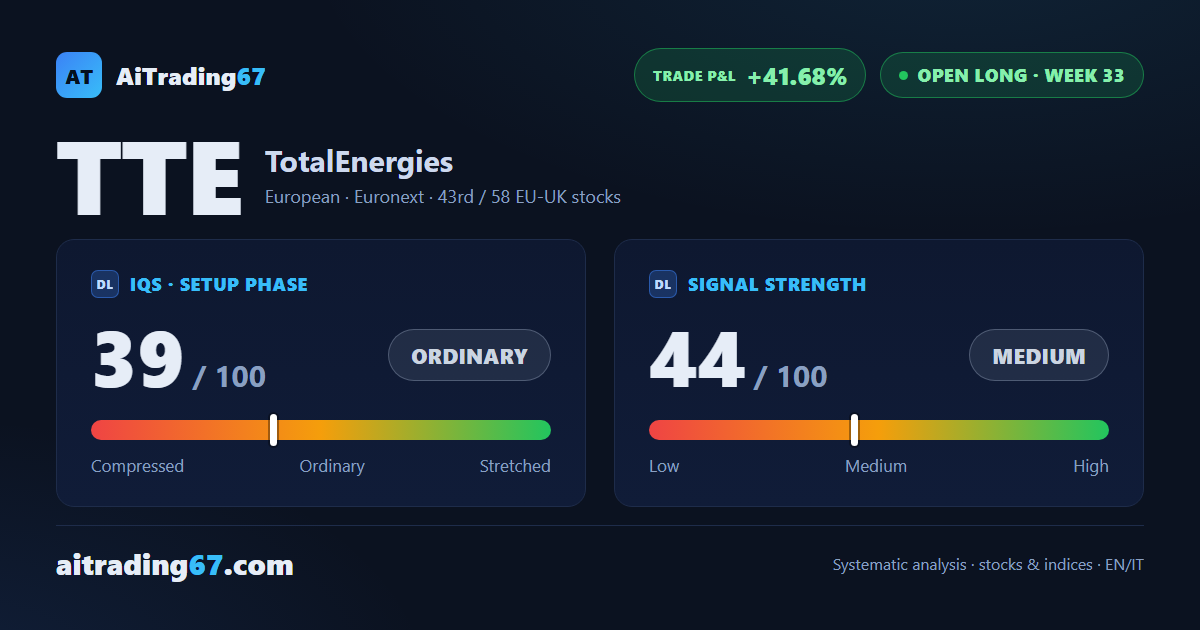
EN IT

TotalEnergies: +41% in 33 weeks, but momentum is fading

The TotalEnergies trade is at week 33, model coverage complete, up 41% from entry. The residual position continues with a trailing stop in the 74 area, but this week momentum has lost pace.

TotalEnergies: +41% in 33 weeks, but momentum is fading
Open long · week 33
TotalEnergies: +41% in 33 weeks, but momentum is fading
June 12, 2026
Open long · week 33
In Summary
TotalEnergies is at week 33 of a buy signal, model coverage complete, up 41% from entry. The remaining 40% continues with a trailing stop in the 74 area, protecting the accumulated gain. This week the technical picture shows a weakening: the session closed down with sellers prevailing and CMF slipping slightly negative.
Open long ·33rd week from start ·EU-UK stocks ·T1 ★ See Gold version →
IQS Phase
39
ordinary
Signal Strength
44
medium · weak
Sizing
REDUCED
Ranking
#43 / 58
EU-UK stocks in progress
Trade P&L %
+41.68%
from signal to today
Chart · Weekly — EMA50 · MACD · VWAP
Weekly chart · EMA50 · MACD · VWAP · Source: TradingView
How to read this pageA visual guide to the post, card by card
The full analysis, operating plan and detailed levels on this asset are reserved for clients ★ PLATINUM
restricted Platinum content
Share WhatsApp Telegram Gmail LinkedIn