
TotalEnergies: the decline loses steam
TotalEnergies bounces 2.2% as the sell signal loses its edge
TotalEnergies: the decline loses steam
Our view last week
TotalEnergies is in week 3 of a sell signal: the week just closed lost 2.1%, and the decline is making lower lows, holding pace with no sign of exhaustion. The stock ranks 12th among the 54 sell signals for European-UK stocks, but the quality band flags trading as not recommended — the price remains 14.7% above the 200-week average. In the background, earnings are approaching, on July 23.
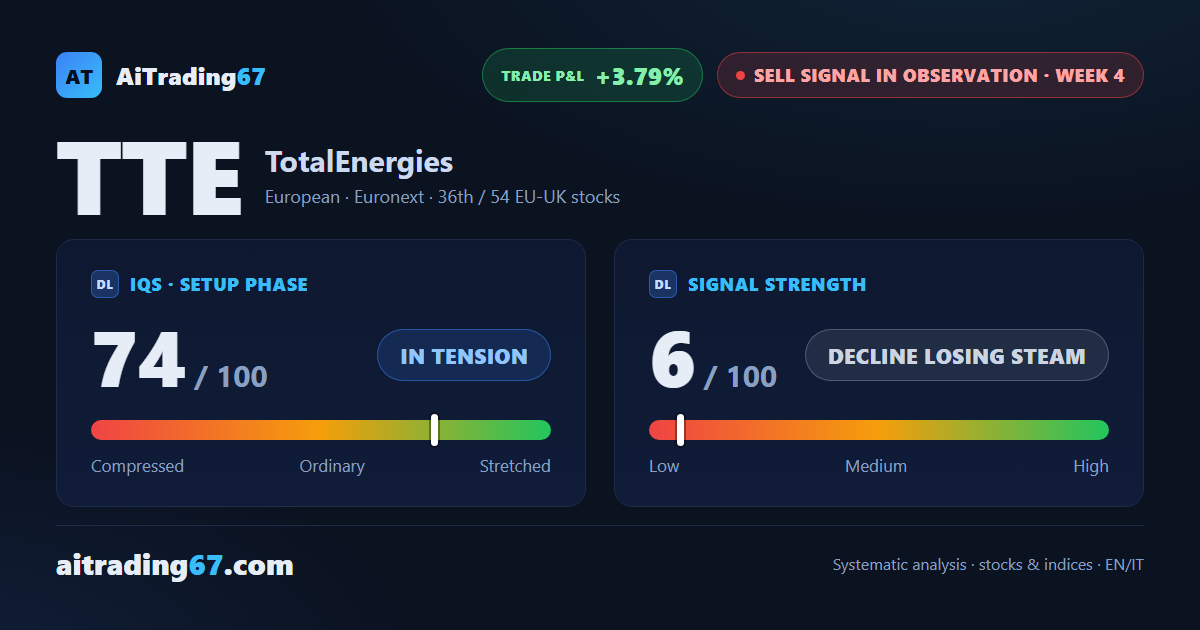
This week's summary
TotalEnergies bounces 2.2%, and the sell signal — in our weekly technical analysis — loses its edge: signal strength drops to 6 out of 100, the lowest reading since it began. The stock slides from 12th to 36th among the 54 European sell signals, while sellers still dominate daily volume (70%). The three-week observation window closes without confirmation: discipline calls for patience before opening new positions.
Sell signal in observation
·4th week from start
·EU-UK stocks
·T2
·📅 Earnings · Jul 23
★ See Gold version →
IQS Phase
74
in tension
Signal Strength
6
decline losing steam
Sizing
MINIMUM
Ranking
#36 / 54
EU-UK stocks sell signals
Trade P&L %
+3.79%
from signal to today
restricted Platinum content