
Coverage complete, the residual now runs
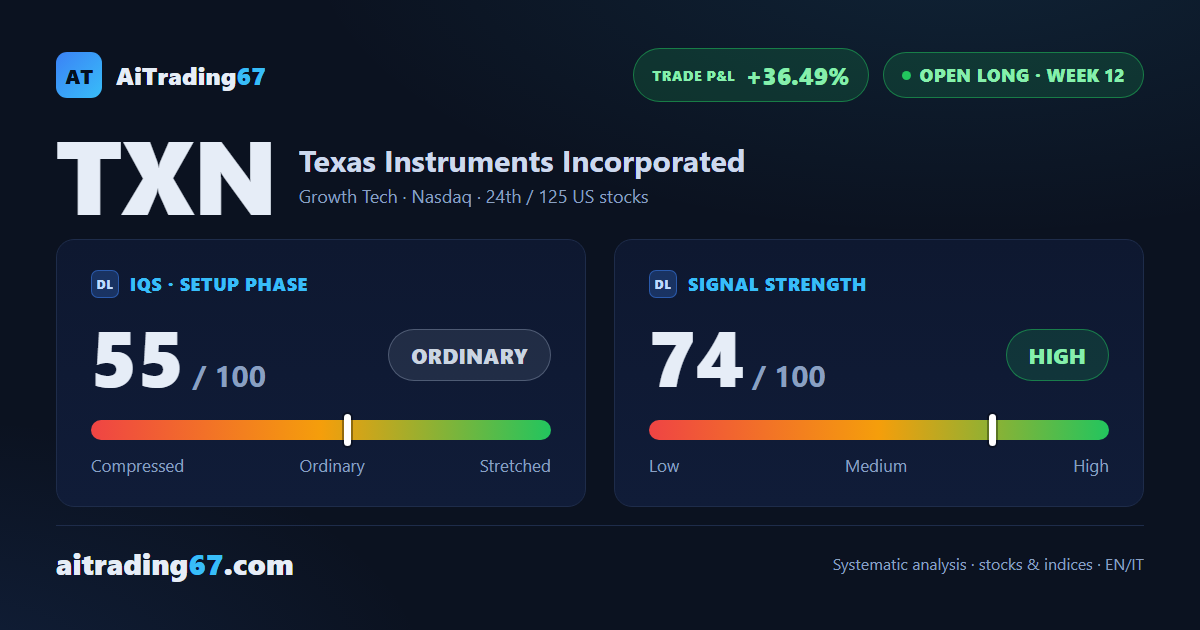
Texas Instruments: week 12, model coverage complete at +36%
Coverage complete, the residual now runs
In Summary
Texas Instruments is in week 12 of a buy signal, and the coverage from our most advanced model is now complete: all 3 targets have been hit. The trade stands at +36.49% since entry, signal strength holds high at 74 out of 100, and the stop now trails the Inversion Point, which has followed the rally all the way here. The full position is still in play: no remaining window to manage, just the discipline of letting it run.
IQS Phase
55
ordinary
Signal Strength
74
high · wide move
Sizing
FULL
Ranking
#24 / 125
US stocks in progress
Trade P&L %
+36.49%
from signal to today
restricted Platinum content