
Texas Instruments: the decline takes shape
Texas Instruments stock sheds 1.4% as the sell signal finds its footing
Texas Instruments: the decline takes shape
Our view last week
Texas Instruments closes the week in the 279 area, boxed in between the daily pivot average and the lower Bollinger Band, after the double bottom in the 275 area that sparked a 15% rebound. The weekly chart triggers a new sell signal, but Strength is already at rock bottom, just 6 out of 100: the decline starts with no momentum of its own. The structural averages stay aligned to the upside and price holds above the Ichimoku cloud, a backdrop that argues for caution on a fresh short entry.
This week's summary
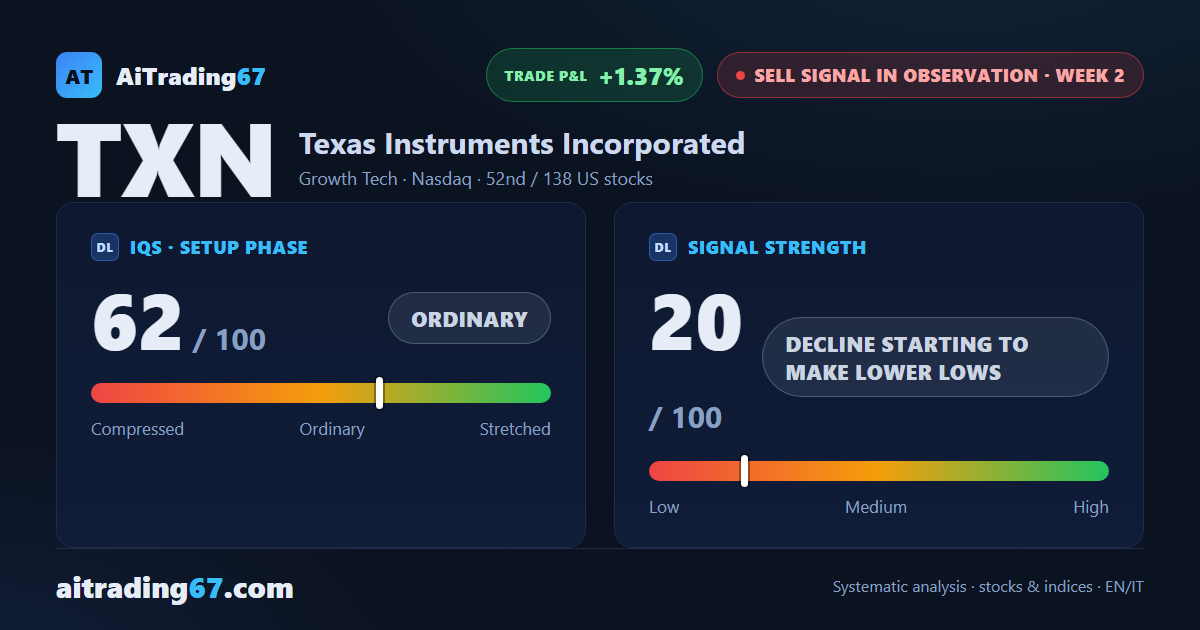
Texas Instruments' sell signal keeps sliding: this week the stock sheds 1.4% and stretches its run of lower highs, from the 315 area toward the 284 area. Signal strength now reads "decline starting to make lower lows" — a week ago it looked nearly spent, now it's finding its footing. Technical analysis of Texas Instruments stock: the confirmation week stays open, quality band flags trading as not recommended.
IQS Phase
62
ordinary
Signal Strength
20
decline starting to make lower lows
Sizing
MINIMUM
Ranking
#52 / 138
US stocks sell signals
Trade P&L %
+1.37%
from signal to date, no stop loss
Rank position
ranks 52nd among the 138 sell signals for US stocks in our ranking, with a signal strength of 20 out of 100.
Sector context
SectorGrowth Tech
Benchmark ETFXLK
Sector regimeweak phase
Performanceweekly -0.30% · monthly -5.53%
TXN belongs to the growth tech sector (reference ETF XLK). The sector is classified weak phase according to our weekly reading.
restricted Platinum content