
Fourth straight up week, profit tops 19%
Unity Software climbs 5.4% this week, but money flow starts to cool
Fourth straight up week, profit tops 19%
Our view last week
Unity Software is at week 11 of a buy signal, with signal strength at 86 out of 100: a wide move, but one to manage with discipline given the elevated volatility. The trade is up 13.12% since entry, and the model's coverage is now complete, with the stop following the Inversion Point. The stock ranks 17th among the 125 buy signals already running for US stocks.
This week's summary
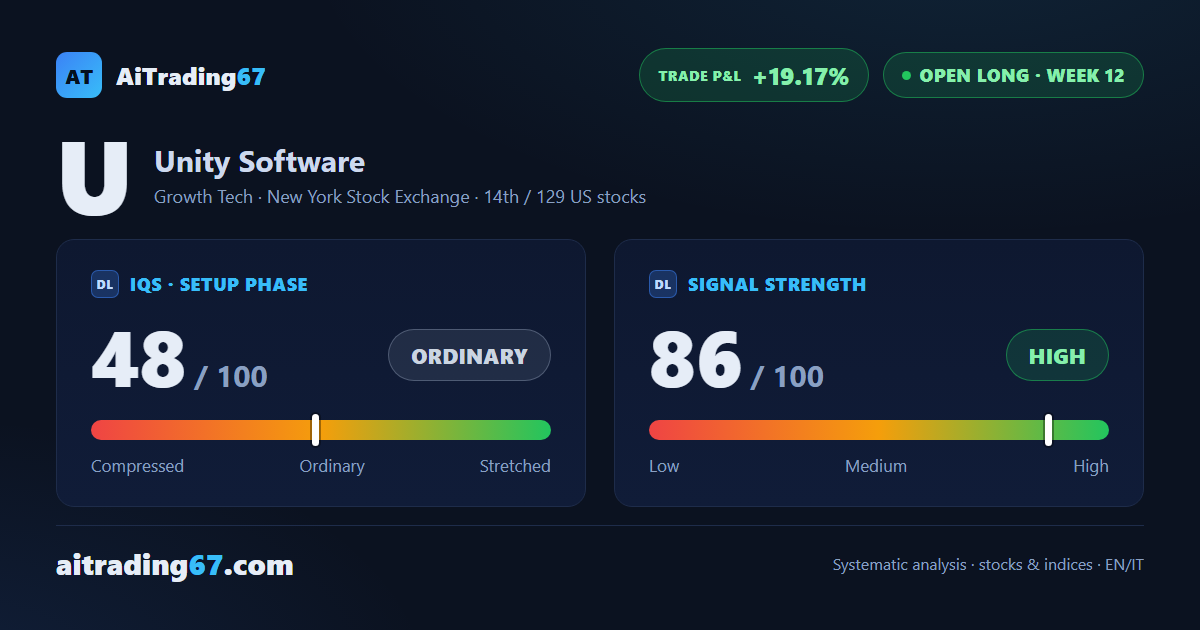
Unity Software shares are on their fourth straight up week, the latest closing with a 5.4% jump that puts the trade past 19% in profit. In this week's technical read the RSI climbs to 55 and price presses under the daily Bollinger Band's upper edge, in the 31 area: buying conviction is thinning, though, with money flow slipping just negative after three positive weeks.
IQS Phase
48
ordinary
Signal Strength
86
high · wide & volatile
Sizing
FULL
Ranking
#14 / 129
US stocks in progress
Trade P&L %
+19.17%
from signal to today
restricted Platinum content