
Managed trade, week 13: the push is fading
Unity Software drops 6.2% as distribution builds on the managed trade
Managed trade, week 13: the push is fading
Our view last week
Unity Software shares are on their fourth straight up week, the latest closing with a 5.4% jump that puts the trade past 19% in profit. In this week's technical read the RSI climbs to 55 and price presses under the daily Bollinger Band's upper edge, in the 31 area: buying conviction is thinning, though, with money flow slipping just negative after three positive weeks.
This week's summary
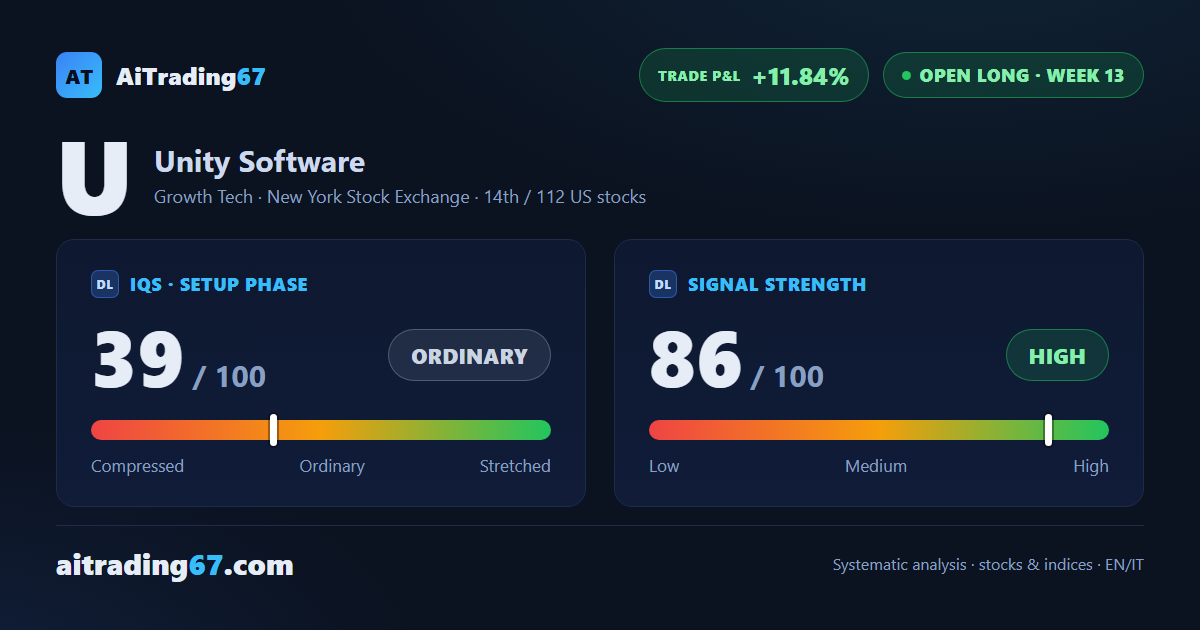
Unity Software closed the week down 6.2%, with 90% of daily volume on the sell side: the buying push that built the double bottom in the 26 area - with a 12% intermediate rebound - is now thinning out. The trade has been open for 13 weeks and sits at 11.84% profit: the underlying structure is still bullish, but fatigue signals (buyer dominance collapsing, distribution underway) are piling up.
IQS Phase
39
ordinary
Signal Strength
86
high · wide & volatile
Sizing
FULL
Ranking
#14 / 112
US stocks in progress
Trade P&L %
+11.84%
from signal to today
restricted Platinum content