
Buy signal running, earnings land this week
United Airlines drops 5.5% as the daily chart turns to higher lows
Buy signal running, earnings land this week
Our view last week
United Airlines is in week 5 of a buy signal opened at full size, with the trade already at +16.13% and 2 of the 3 targets from our most advanced model already hit. Signal strength is medium, at 59 out of 100, and the stock ranks 61st among the 125 open buy positions in US stocks. Earnings land on July 15.
This week's summary
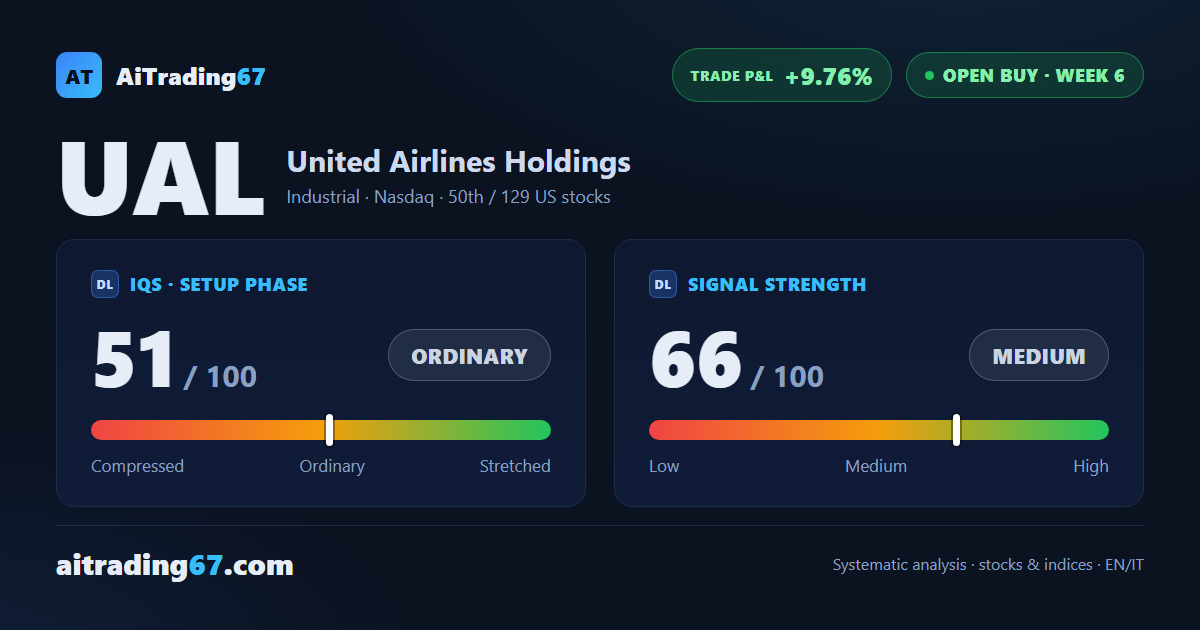
United Airlines shares closed the week down 5.5%, but the daily chart already tells a different story: three higher lows have carried the price from the 115 area back to 122, an early sign of stabilization after the drop. The buy signal is in week 6, the trade sits at +9.76%, and earnings land this very week. Signal strength holds steady at 66 out of 100.
IQS Phase
51
ordinary
Signal Strength
66
medium
Sizing
STANDARD
Ranking
#50 / 129
US stocks in progress
Trade P&L %
+9.76%
from signal to today
restricted Platinum content