
Sell signal, week 4 · US stocks
Uber slips 2.2%: 5th down week in a row as the weekly MACD crosses below its signal line
Our view last week
Four lower highs on the daily chart, from the 78 area down to the 70 area, and a cluster of moving averages in the 72 area that has turned price back several times: Uber stock's price action keeps drawing the decline, with the week down 1.2%. Compared with a week ago, signal strength is slipping again and the ADX stays very low, so the decline is moving without push. The sell signal is in week 3, and our model rates any fresh opening as high risk.
This week's summary
Uber slipped 2.2% in its 5th straight down week and closed below its 200-week moving average, in the 68 area. Price action still draws an orderly decline, with 4 lower highs on the daily chart, and the weekly MACD has crossed below its signal line after 23 weeks. Compared with a week ago, the decline has found its pace again. Technical analysis of Uber stock leaves little room before the lows, though: the sell signal is in week 4 and, among US stocks, a fresh opening stays high risk.
Sell signal in observation
·4th week from start
·US stocks
·T2
·📅 Earnings · Oct 29
★ See Gold version →
IQS Phase
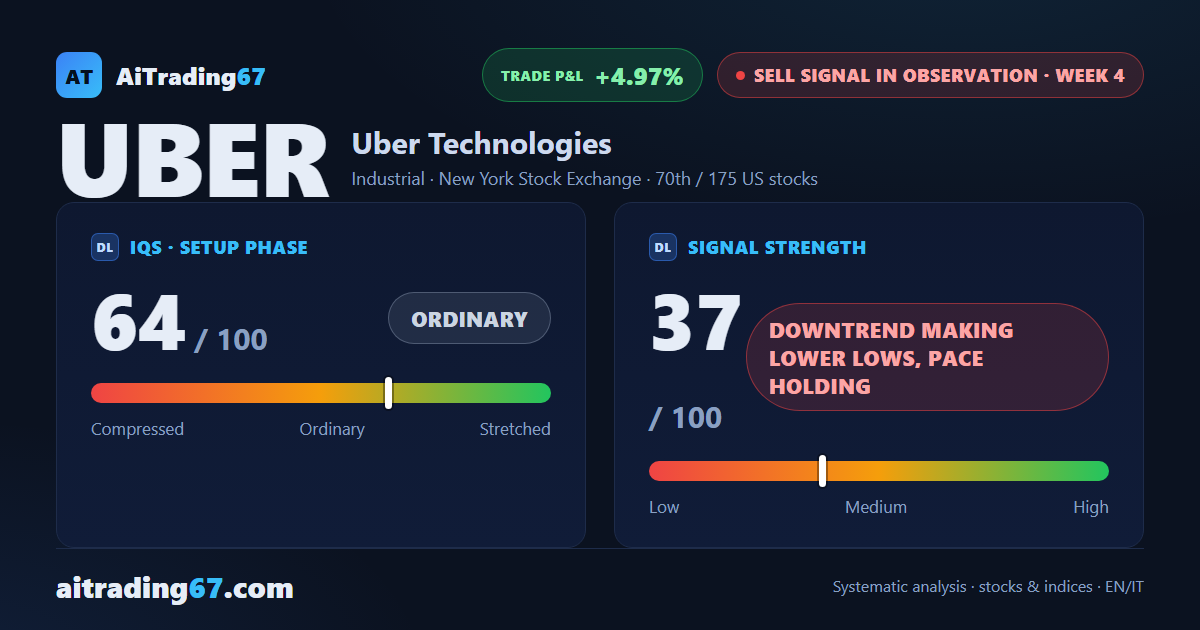
64
ordinary
Signal Strength
37
downtrend making lower lows, pace holding
Sizing
REDUCED
Ranking
#70 / 175
US stocks sell signals
Trade P&L %
+4.97%
from signal to date, no stop loss
Uber Technologies (UBER) weekly chart — EMA50 · MACD · VWAP
Weekly chart · EMA50 · MACD · VWAP · Source: TradingView
Rank position
ranks 70th among the 175 sell signals for US stocks in our ranking, with a signal strength of 37 out of 100.
Sector context
SectorIndustrial
Benchmark ETFXLI
Sector regimeweak phase
Performanceweekly -0.28% · monthly -1.64%
UBER belongs to the industrial sector (reference ETF XLI). The sector is classified weak phase according to our weekly reading.
restricted Platinum content