
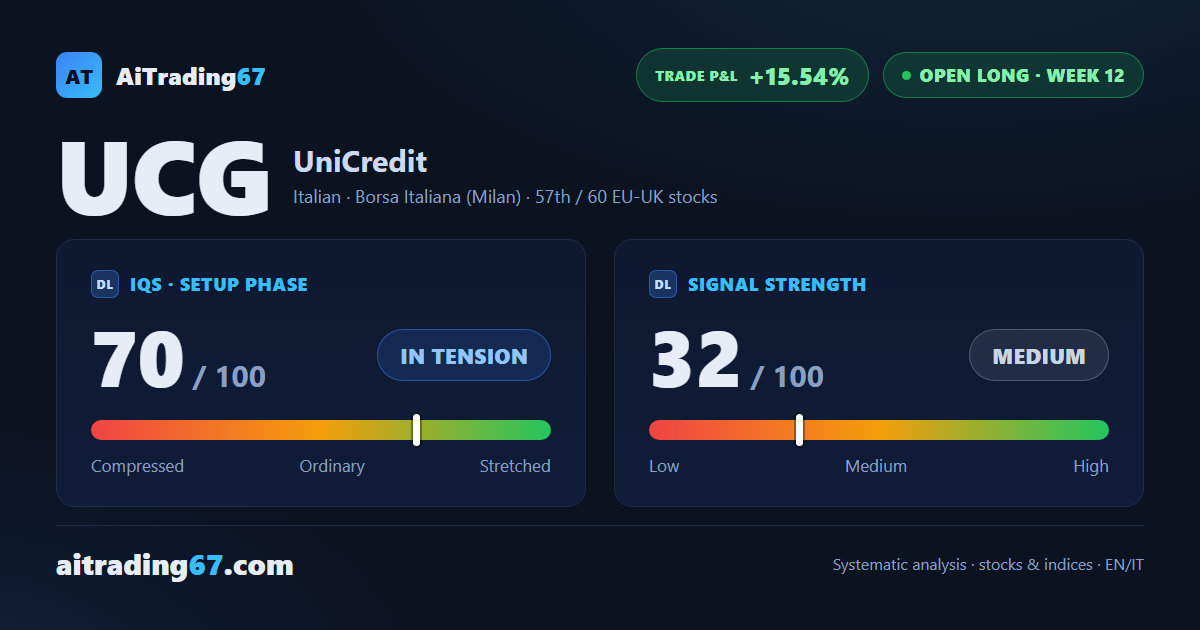
UniCredit near highs, pace slowing
UniCredit gains 1.2% and stays pinned near the highs, boxed between two levels
UniCredit near highs, pace slowing
Our view last week
UniCredit is in week 11 of a buy signal and is up 14% since entry. All 3 model targets have already been hit: coverage is complete, and the stop now trails the Inversion Point. The weekly structure remains bullish, but signal strength has dropped to 32 out of 100, and the week showed the first signs of fading buyer momentum.
This week's summary
UniCredit's stock is pushing back toward its highs: after last week's first signs of fatigue, the stock rebounded 5% off its own 20-day moving average, with buyers still commanding 88% of volume. Price, though, stays boxed into a very tight band between a resistance and a support just a few tenths apart, a sign the push, while real, is struggling for room. The trade is in its 12th week and running up 15.5% since entry.
IQS Phase
70
in tension
Signal Strength
32
medium · weak
Sizing
REDUCED
Ranking
#57 / 60
EU-UK stocks in progress
Trade P&L %
+15.54%
from signal to today
restricted Platinum content