
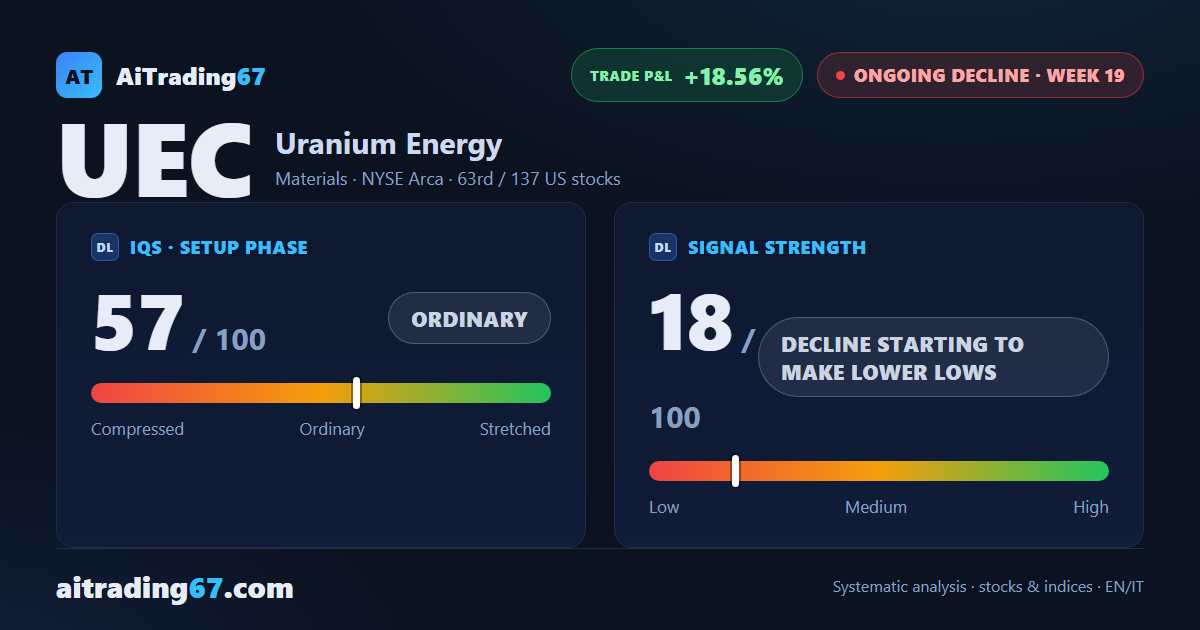
Uranium Energy, week 19 of the sell signal: +18.6%
Uranium Energy slips 2.2% this week, pinned to its daily pivot point
Uranium Energy, week 19 of the sell signal: +18.6%
Our view last week
Week 18 of the sell signal on Uranium Energy Corp., and the week closed down 0.3%, a contained move after far choppier weeks. The stock remains pinned between a double bottom formed in the 10 area and a nearby resistance just above: the decline holds, but without fresh drive.
This week's summary
Uranium Energy remains boxed into a very tight range around its daily pivot point, between the 10.46 and 10.57 areas: contracting volume, a mixed rejection candle, an indecisive phase. The week closed down 2.2%, after the 10.1% plunge two weeks ago. The double bottom in the 9.5 area, with a 32% rebound, shows a floor is already in place. The sell signal, live for 19 weeks, is still up more than 18%.
IQS Phase
57
ordinary
Signal Strength
18
decline starting to make lower lows
Sizing
MINIMUM
Ranking
#63 / 137
US stocks
Trade P&L %
+18.56%
from signal to today
restricted Platinum content