EN IT

Unilever: technical bounce within an ongoing decline

Unilever is at week 14 of a sell signal with an 11% gain from entry. The week closed up 4.7%, but the underlying bearish structure remains intact: CMF, MACD, and momentum all confirm the reading.

Unilever: technical bounce within an ongoing decline
Ongoing decline — week 14 · Trading not recommended
Unilever: technical bounce within an ongoing decline
June 12, 2026
Ongoing decline — week 14 · Trading not recommended
In Summary
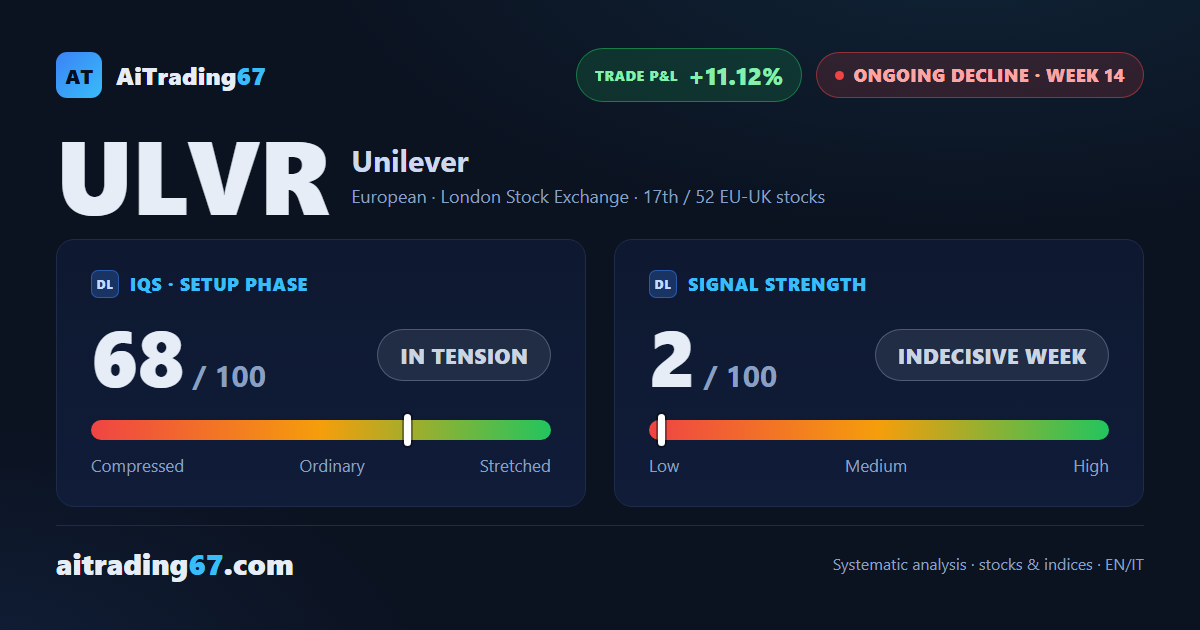
Unilever is at week 14 of a sell signal, with an 11.12% gain from trade entry. The week closed up 4.7%, with a technical bounce off the daily EMA20 in the 4260 area. A move to read with caution: the weekly structure remains bearish and the AT picture shows no reversal yet.
Ongoing decline ·14th week from start ·EU-UK stocks ·T2 ★ See Gold version →
IQS Phase
68
in tension
Signal Strength
2
indecisive week
Sizing
MINIMUM
Ranking
#17 / 52
EU-UK stocks
Trade P&L %
+11.12%
from signal to today
Chart · Weekly — EMA50 · MACD · VWAP
Weekly chart · EMA50 · MACD · VWAP · Source: TradingView
How to read this pageA visual guide to the post, card by card
The full analysis, operating plan and detailed levels on this asset are reserved for clients ★ PLATINUM
restricted Platinum content
Share WhatsApp Telegram Gmail LinkedIn