EN IT

Unilever: MACD histogram converges toward the signal line after months of distribution

Unilever weekly technical analysis — week 15 of a sell signal, +11.58% performance since inception. MACD histogram turns positive for the first time in months, but sellers remain prevalent and the bearish structure holds. Trading not recommended for new entries.

Unilever: MACD histogram converges toward the signal line after months of distribution
Unilever · 15th week of decline
Unilever: MACD histogram converges toward the signal line after months of distribution
June 19, 2026
Unilever · 15th week of decline
In Summary
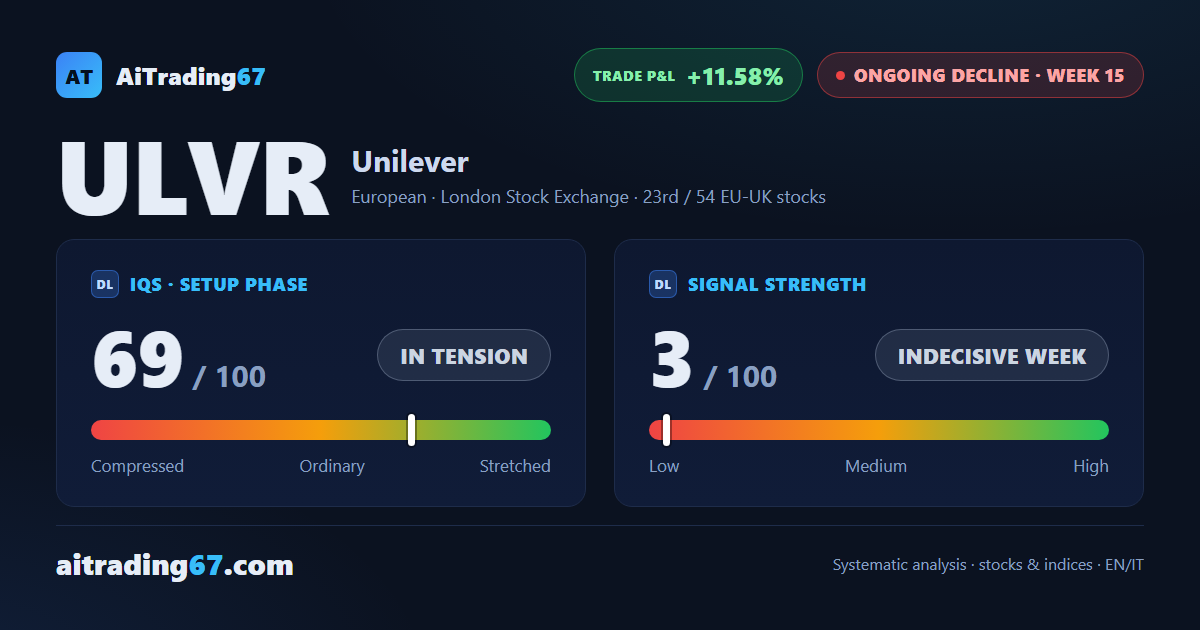
Unilever is in week 15 of a sell signal, with a gain of 11.58% since inception. The week closed slightly lower, but under the surface the technical picture shows the first signs of trend exhaustion: the MACD histogram has turned positive for the first time in months and momentum has reversed. The quality band flags trading as not recommended: no new short entries.
Ongoing decline ·15th week from start ·EU-UK stocks ·T2 ★ See Gold version →
IQS Phase
69
in tension
Signal Strength
3
indecisive week
Sizing
MINIMUM
Ranking
#23 / 54
EU-UK stocks
Trade P&L %
+11.58%
from signal to today
Chart · Weekly — EMA50 · MACD · VWAP
Weekly chart · EMA50 · MACD · VWAP · Source: TradingView
How to read this pageA visual guide to the post, card by card
The full analysis, operating plan and detailed levels on this asset are reserved for clients ★ PLATINUM
restricted Platinum content
Share WhatsApp Telegram Gmail LinkedIn