
Unilever, confirmation stays weak
Unilever slips 0.5%, stalling again at its 200-day moving average
Unilever, confirmation stays weak
Our view last week
Unilever opens a new buy signal, in its 1st week of trade. The confirmation week closed higher, but our model reads the setup as technically weak: signal strength sits at 44 out of 100 and the setup quality indicator is at 57, in an ordinary phase. The stock ranks 43rd among the 62 open buys in European-UK stocks.
This week's summary
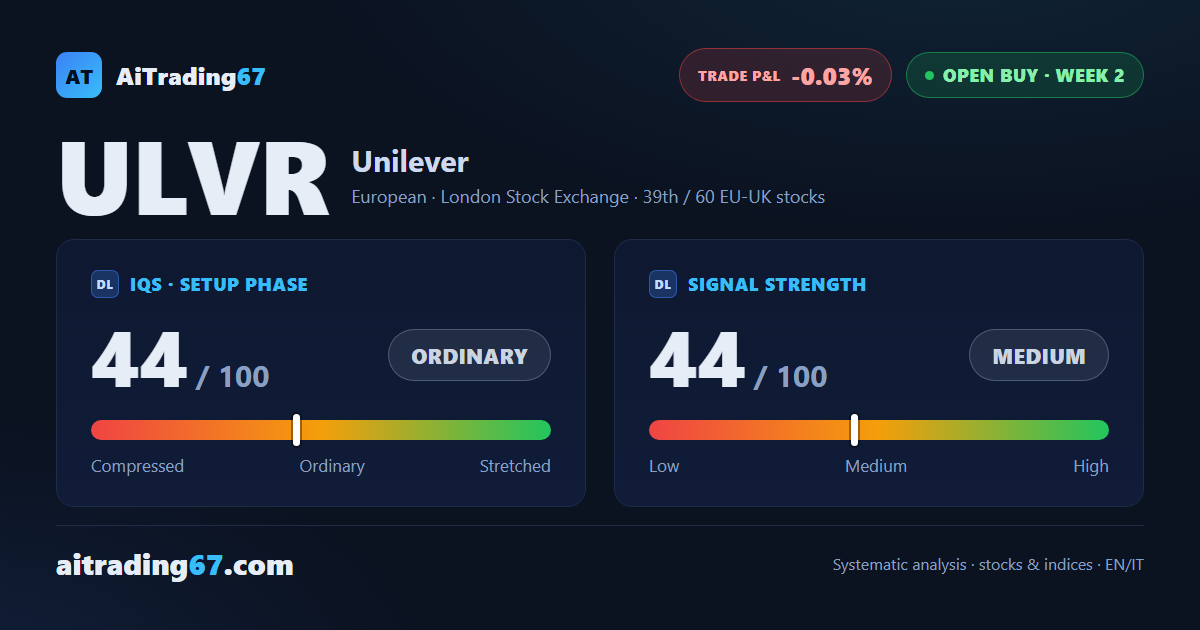
Unilever's rally has stalled again at its 200-day moving average, in the 4684 area: the third rejection there in just a few months, the latest coming this very confirmation week. The stock closes down 0.5%, with volume contracting and distribution building. Below, the first support is holding in the 4582 area. The setup quality indicator drops to 44 out of 100, and our model still reads the picture as technically weak.
IQS Phase
44
ordinary
Signal Strength
44
medium · weak
Sizing
REDUCED
Ranking
#39 / 60
EU-UK stocks in progress
Trade P&L %
-0.03%
from signal to today
restricted Platinum content