
Sell signal · week 12
United Airlines slips 1.3% and loses the 20-week average it had just reclaimed
Our view last week
United Airlines stock closed the week up 4.9%, and money flow turned positive after 7 weeks below zero. Last week buyers owned the tape while price slipped; this time price followed them. For price action trading the picture is a decline losing its grip: on the daily chart the stock bounced off its 20-day moving average, and the short is down to a 1.2% gain since entry.
This week's summary
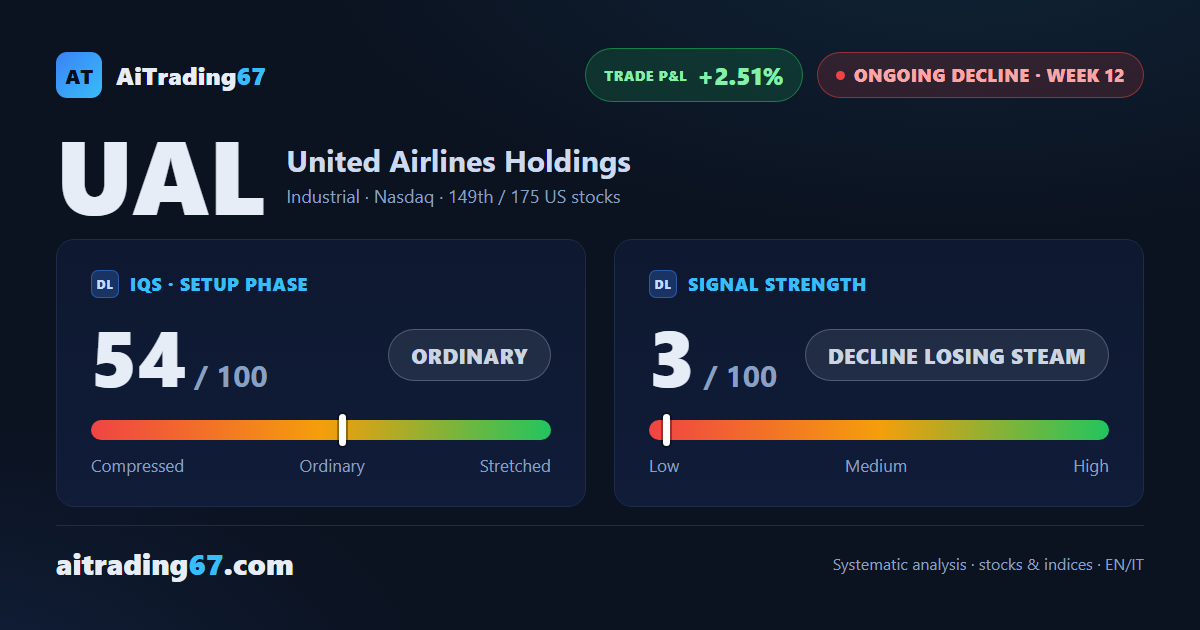
United Airlines stock slipped 1.3% and lost its 20-week moving average again, a level it had reclaimed only last week with a 4.9% gain. Money flow stays positive for a 2nd week but has stopped improving, and ADX has been falling for 7 weeks: for price action trading, this is a stalled decline with no push behind it. On the daily chart the stock bounced 3% off the 109 area. Among US stocks on a sell signal, the short is up 2.5% since entry, with earnings due on October 20.
IQS Phase
54
ordinary
Signal Strength
3
decline losing steam
Sizing
MINIMUM
Ranking
#149 / 175
US stocks
Trade P&L %
+2.51%
from signal to date, no stop loss
United Airlines (UAL) weekly chart — EMA50 · MACD · VWAP
Weekly chart · EMA50 · MACD · VWAP · Source: TradingView
Rank position
ranks 149th among the 175 sell signals for US stocks in our ranking, with a signal strength of 3 out of 100.
Sector context
SectorIndustrial
Benchmark ETFXLI
Sector regimeweak phase
Performanceweekly -0.28% · monthly -1.64%
UAL belongs to the industrial sector (reference ETF XLI). The sector is classified weak phase according to our weekly reading.
restricted Platinum content