
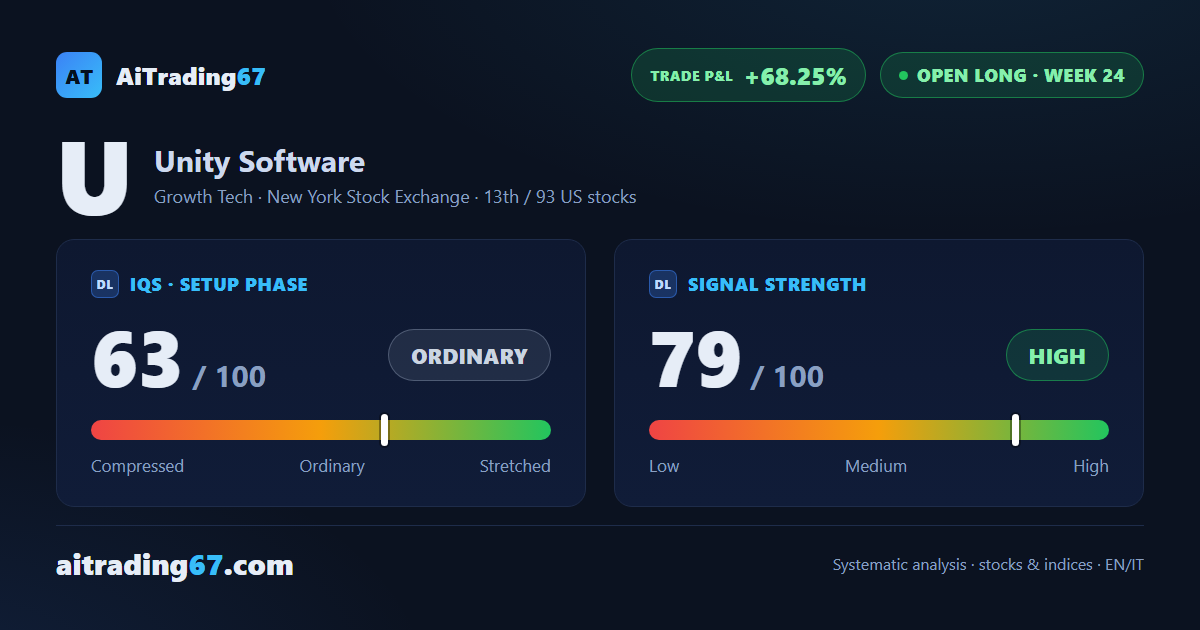
US stocks · open long, week 24
Unity gains 5% on an 11% rebound from the 39 area while the MACD keeps losing steam
Our view last week
On the daily chart Unity stock bounces 6% off its 50-day moving average in the 40 area, and the week closes up 0.4% after the prior week's 5.8% drop. It's a hold, with sellers still at 55% of volume and money flow positive: the price action needs confirming, a name to watch among US tech stocks. Price closed below the second stop level (SL2) flagged in last week's card (41.57 area): for anyone following that level the trade is closed. The close and the Inversion Point, in the 42 area, have already crossed with no change of sign declared: one to watch in the coming sessions.
This week's summary
Unity closes the week up 5% after an 11% rebound from the 39 area that put the price back above its 20-day moving average. A week ago the hold needed confirming: a first answer has come, with money flow at its highest reading in 4 weeks. On Unity stock, though, technical analysis shows a MACD losing steam, its histogram falling for 6 weeks. Among US tech stocks, the long trade is up 68% since entry and the price action still needs watching.
IQS Phase
63
ordinary
Signal Strength
79
high · wide & volatile
Sizing
FULL
Ranking
#13 / 93
US stocks in progress
Trade P&L %
+68.25%
from signal to date, no stop loss
Unity Software (U) weekly chart — EMA50 · MACD · VWAP
Weekly chart · EMA50 · MACD · VWAP · Source: TradingView
Rank position
ranks 13th among the 93 Longs already running for US stocks in our ranking, with a signal strength of 79 out of 100.
Sector context
SectorGrowth Tech
Benchmark ETFXLK
Sector regimein strong phase
Performanceweekly +1.80% · monthly +8.83%
U belongs to the growth tech sector (reference ETF XLK). The sector is classified in strong phase according to our weekly reading.
restricted Platinum content