
Week 10: gains locked in, little fresh drive left
USMV slips 0.1%: a daily hammer rejects the pullback near the highs
Week 10: gains locked in, little fresh drive left
Our view last week
USMV, a low-volatility ETF, is in the 9th week of a buy signal: the weekly structure stays bullish but signal strength has dropped to 12 out of 100, a weak-conviction profile. The stop has already moved to breakeven, zeroing out the trade risk, and the price is hugging a resistance band that has already been contested multiple times.
This week's summary
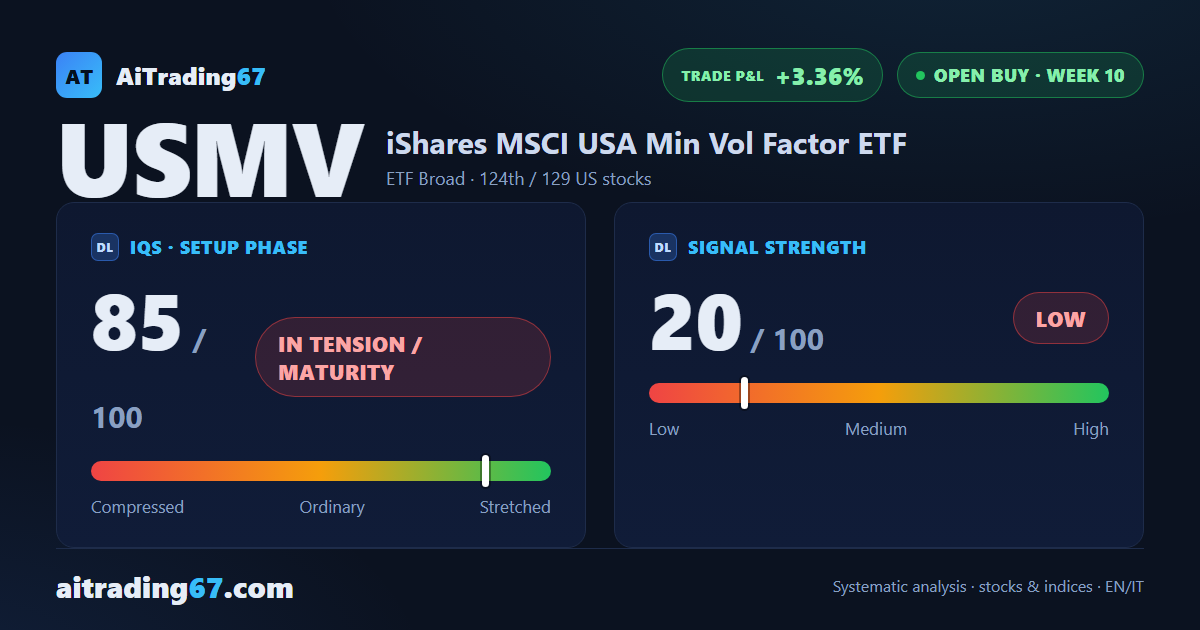
In USMV's weekly technical analysis, this low-volatility ETF's daily hammer firmly rejects the pullback attempt: the week closes almost flat, -0.1%, with price still hugging its record highs, a level already tested twice. Underneath, the push is fading — signal strength is low and weakening — and among US Longs still open, USMV has slipped to 124th out of 129. The trade, in its 10th week, remains in profit.
IQS Phase
85
in tension / maturity
Signal Strength
20
low · fading
Sizing
MINIMUM
Ranking
#124 / 129
US stocks in progress
Trade P&L %
+3.36%
from signal to today
restricted Platinum content