
USMV -1.2%: the wall at the highs still holds
USMV slips 1.2% but stays a step from highs already tested three times
USMV -1.2%: the wall at the highs still holds
Our view last week
In USMV's weekly technical analysis, this low-volatility ETF's daily hammer firmly rejects the pullback attempt: the week closes almost flat, -0.1%, with price still hugging its record highs, a level already tested twice. Underneath, the push is fading — signal strength is low and weakening — and among US Longs still open, USMV has slipped to 124th out of 129. The trade, in its 10th week, remains in profit.
This week's summary
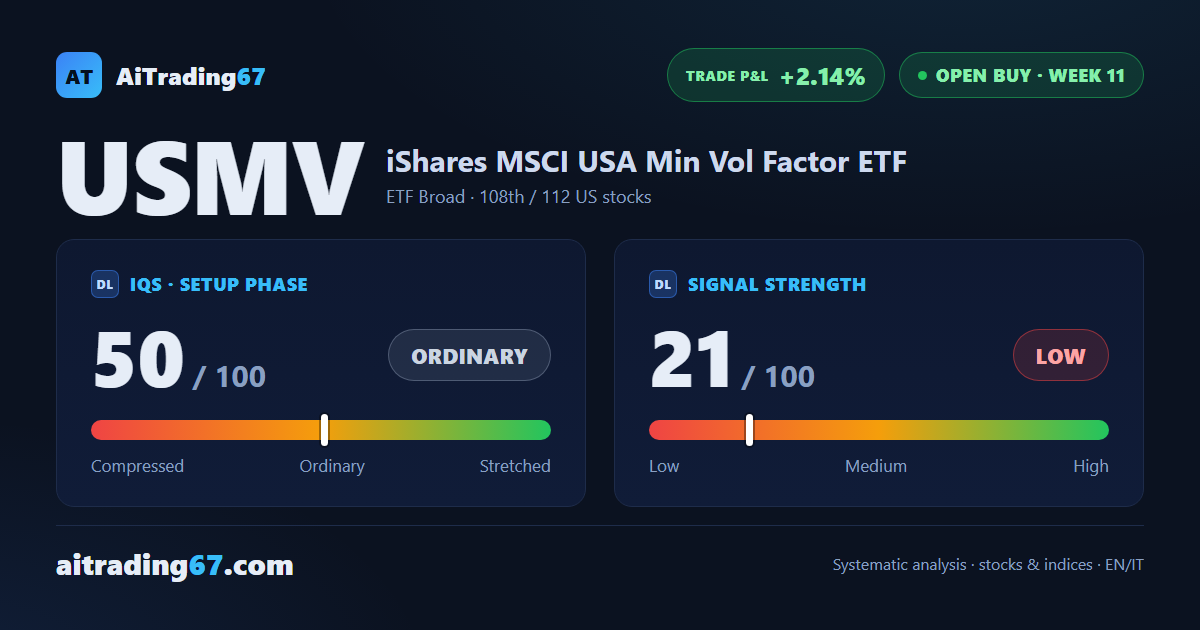
USMV's weekly technical analysis shows the low-volatility US stock ETF still knocking on its record highs - tested three times already without breaking - though the stock gave back 1.2% this week. Beneath the surface buyer dominance is fading, and sellers took the upper hand on the last bar. The buy signal is in its 11th week, up 2.14% from entry, with signal strength now low.
IQS Phase
50
ordinary
Signal Strength
21
low · fading
Sizing
MINIMUM
Ranking
#108 / 112
US stocks in progress
Trade P&L %
+2.14%
from signal to today
restricted Platinum content