
US utilities ETF · sell signal in week 9
XLU edges up 0.8%: the new 30-week low is not confirmed by the weekly close
Our view last week
XLU, the US utilities sector ETF, closes a third straight losing week with a 3.9% drop and slides onto its 200-week moving average, in the 39.5 area. Sellers still own the weekly bar with 79% of volume, less extreme than last week's 99%, and the weekly RSI slips to 30.7, right at the oversold line. In XLU technical analysis, the price action describes a decline holding its pace: the short climbs to 9.4% in profit since entry.
This week's summary
XLU drops to a new 30-week low, in the 39 area, and the weekly close does not confirm it: the week ends up 0.8%, back above the 200-week moving average it had only just touched 7 days ago. For XLU, the US utilities sector ETF, it is the first gain after 3 weeks of declines. In this XLU technical analysis the picture stays bearish: daily price action shows 3 lower highs and, as a swing trading setup, the sell signal is still live, with the short up 8.7%.
IQS Phase
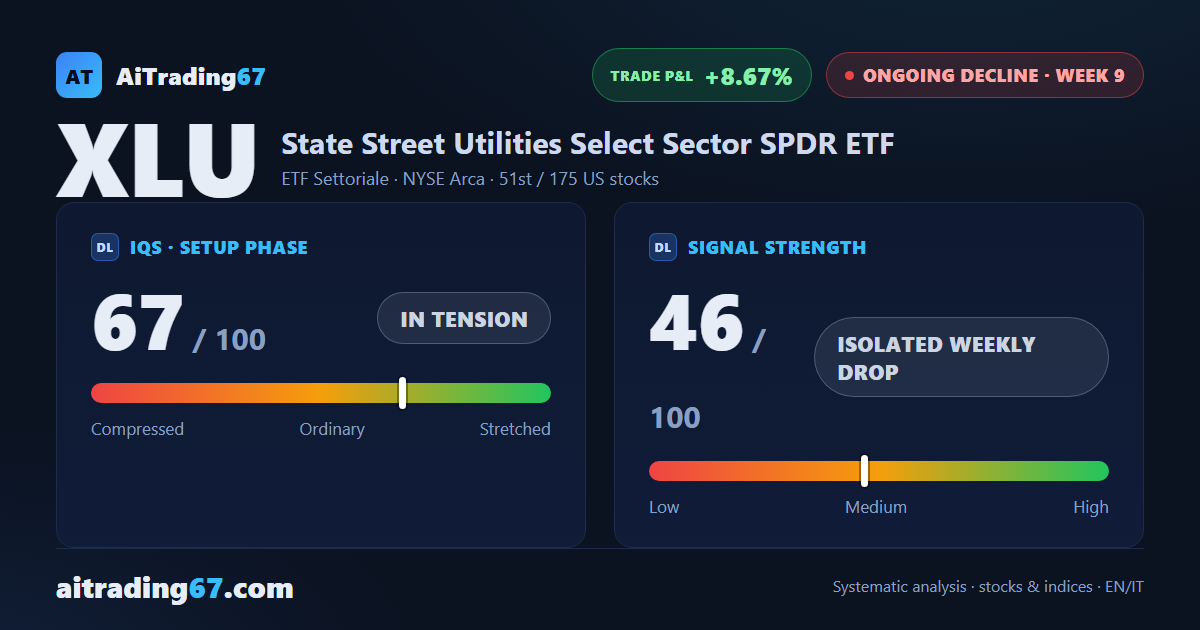
67
in tension
Signal Strength
46
isolated weekly drop
Sizing
REDUCED
Ranking
#51 / 175
US stocks
Trade P&L %
+8.67%
from signal to date, no stop loss
Utilities US (XLU) weekly chart — EMA50 · MACD · VWAP
Weekly chart · EMA50 · MACD · VWAP · Source: TradingView
Rank position
ranks 51st among the 175 sell signals for US stocks in our ranking, with a signal strength of 46 out of 100.
Sector context
SectorETF Settoriale
Benchmark ETFXLU
Sector regimeweak phase
Performanceweekly +0.81% · monthly -6.66%
XLU belongs to the etf settoriale sector (reference ETF XLU). The sector is classified weak phase according to our weekly reading.
restricted Platinum content