
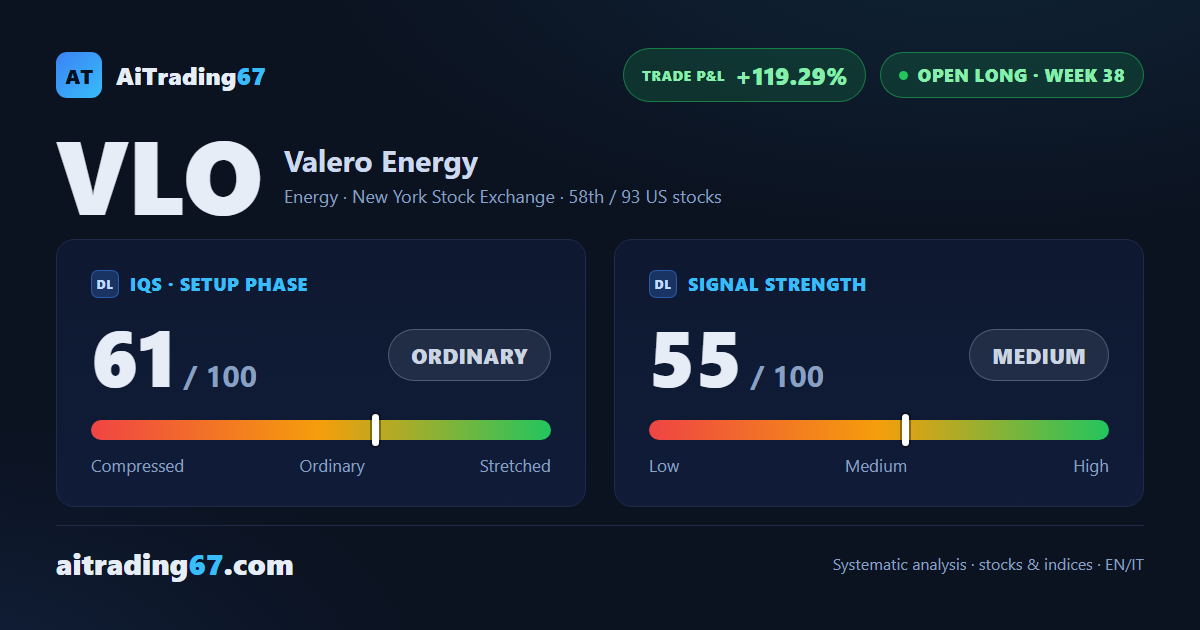
US energy · open long, week 38
Valero rebounds 4.9% to just under its all-time high as MACD and momentum lose pace
Our view last week
After 6 straight up weeks, Valero drops 6.3% and volume switches sides: 59% of the week's trade is on the sell side, against 92% on the buy side seven days ago. Technical analysis of Valero stock bears out last week's warning, with RSI down from 82.8 to 72.3. On the daily chart, though, price found support in the 365 area and bounced 6%, back above the 20-day moving average. The structure stays bullish, and the trade is up 109% since entry.
This week's summary
Valero rebounds 4.9% after last week's 6.3% drop and is back just under its all-time high, with money flow improving and the ADX rising for 13 weeks. Technical analysis of Valero stock shows a less lively engine, though: the MACD histogram has been falling for 2 weeks and the RSI, at 74.8, sits below its 82.8 peak. Daily price action points to continuation, and among energy stocks this weekly buy signal is still running, up 119% since entry.
IQS Phase
61
ordinary
Signal Strength
55
medium
Sizing
STANDARD
Ranking
#58 / 93
US stocks in progress
Trade P&L %
+119.29%
from signal to date, no stop loss
Valero Energy (VLO) weekly chart — EMA50 · MACD · VWAP
Weekly chart · EMA50 · MACD · VWAP · Source: TradingView
Rank position
ranks 58th among the 93 Longs already running for US stocks in our ranking, with a signal strength of 55 out of 100.
Sector context
SectorEnergy
Benchmark ETFXLE
Sector regimein positive regime
Performanceweekly +1.26% · monthly -3.50%
VLO belongs to the energy sector (reference ETF XLE). The sector is classified in positive regime according to our weekly reading.
restricted Platinum content