
US energy ETF · new Sell signal, week 1
VDE gains 1.3% and breaks its run of lower highs, yet a new Sell signal fires
Our view last week
VDE, the Vanguard energy ETF, drops 3.7% for a second straight losing week: the price action shows sellers extremely dominant in the weekly bar, and money flow has slipped below zero after 6 positive weeks. For VDE technical analysis it's a delicate moment for this swing trading buy signal. Price closed below the first stop level (SL1) and the second stop level (SL2) flagged in last week's card (174.51 area, 174.45 area): for anyone following those levels the trade is closed. The close and the Inversion Point, in the 174.51 area, have already crossed with no change of sign declared: one to watch in the coming sessions.
This week's summary
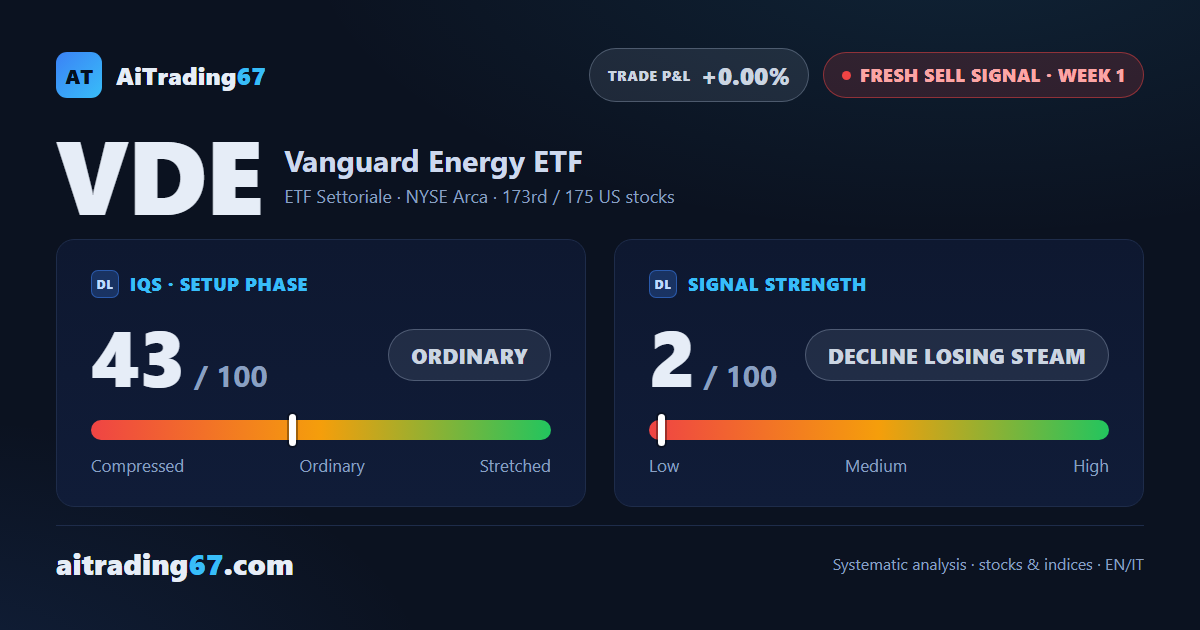
VDE, the Vanguard energy ETF, ends the week up 1.3% and on the daily chart breaks the run of 5 lower highs that began on September 10. Yet this is the week a new Sell signal fires: last week the close had already crossed the Inversion Point, now the model declares the change of sign. VDE technical analysis shows a decline with no fresh push, signal strength at 2 out of 100: for swing trading it is a trade setup to watch.
IQS Phase
43
ordinary
Signal Strength
2
decline losing steam
Sizing
MINIMUM
Ranking
#173 / 175
New us stocks
Trade P&L %
+0.00%
from signal to date, no stop loss
VDE Energy US weekly chart — EMA50 · MACD · VWAP
Weekly chart · EMA50 · MACD · VWAP · Source: TradingView
Rank position
ranks 173rd among the 175 sell signals for US stocks in our ranking, with a signal strength of 2 out of 100.
Sector context
SectorETF Settoriale
Benchmark ETFXLE
Sector regimein positive regime
Performanceweekly +1.26% · monthly -3.50%
VDE belongs to the etf settoriale sector (reference ETF XLE). The sector is classified in positive regime according to our weekly reading.
restricted Platinum content