
Sell signal, week 2 · US stocks
Verizon slips 2.5% and loses its 50-week average, with a fresh 30-day low
Our view last week
Verizon stock drops 2.1%, a second losing week, and the price action shows sellers ahead in the weekly bar: seven days ago a buy signal was still in place, now a fresh Sell signal kicks in. The price has broken out of last week's corridor to the downside and now works between the daily Inversion Point average, in the 47.1 area, and the daily Kumo ceiling, in the 47.0 area. With the ADX falling for 3 weeks, the technical analysis reads a decline with no fresh push.
This week's summary
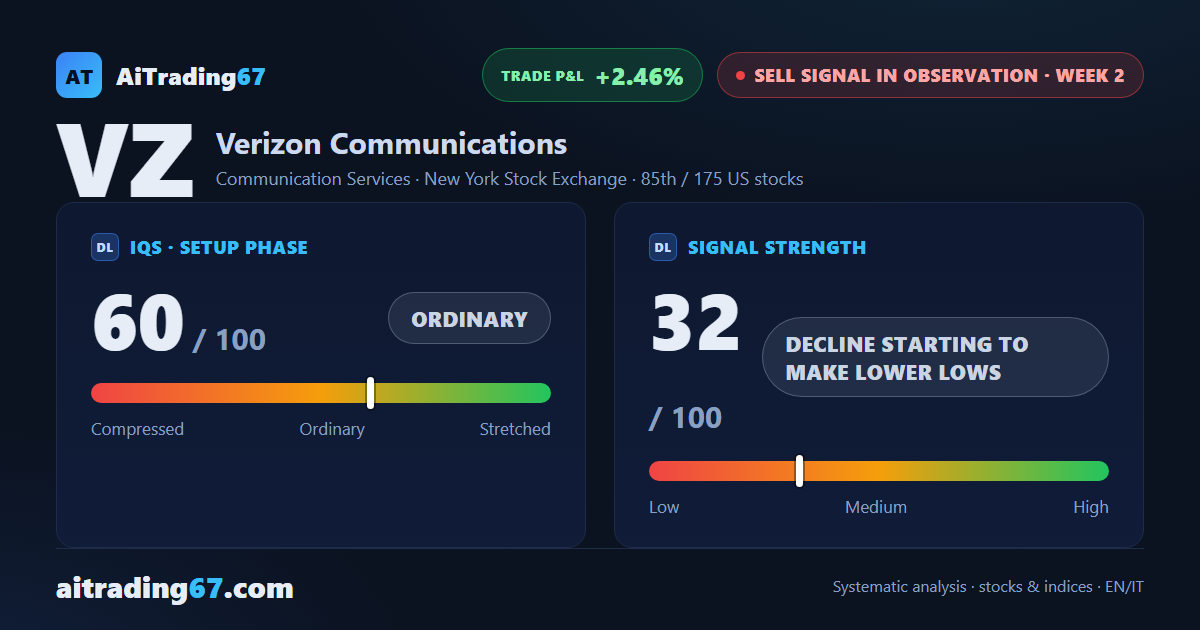
Verizon loses its 50-week average: the stock drops 2.5%, a third losing week, and prints a fresh 30-day low confirmed on the close. Compared with a week ago the Sell signal has gained substance, with the weekly MACD slipping under its Signal line and money flow turning negative after 8 weeks. Technical analysis reads a decline starting to make lower lows, one of the US stocks where price action still lacks push: the ADX has been falling for 4 weeks.
Sell signal in observation
·2nd week from start
·US stocks
·T2
·📅 Earnings · Oct 26
★ See Gold version →
IQS Phase
60
ordinary
Signal Strength
32
decline starting to make lower lows
Sizing
REDUCED
Ranking
#85 / 175
US stocks sell signals
Trade P&L %
+2.46%
from signal to date, no stop loss
Verizon Communications (VZ) weekly chart — EMA50 · MACD · VWAP
Weekly chart · EMA50 · MACD · VWAP · Source: TradingView
Rank position
ranks 85th among the 175 sell signals for US stocks in our ranking, with a signal strength of 32 out of 100.
Sector context
SectorCommunication Services
Benchmark ETFXLC
Sector regimein positive regime
Performanceweekly -2.34% · monthly -1.87%
VZ belongs to the communication services sector (reference ETF XLC). The sector is classified in positive regime according to our weekly reading.
restricted Platinum content