
Global ex-US equity ETF · New sell signal
VEU slips 1.1% and loses its 50-day average as a Sell signal kicks in
Our view last week
VEU closed the week up 0.6%, snapping two down weeks, with money flow turning higher again and positive for 7 weeks now. The MACD, though, stays under its Signal line for a third week, and the ADX has been losing conviction for 14 weeks. This VEU technical analysis of the Vanguard ex-US international ETF finds indecisive price action, with price squeezed between its 20-day and 50-day moving averages. The trade is up 6.5% since entry.
This week's summary
VEU lost 1.1% and dropped below its 50-day average, which was still holding a week ago: on that slip a new Sell signal kicks in. This VEU technical analysis of the Vanguard ETF on world equities outside the US finds mixed price action: MACD under its Signal line for 4 weeks and ADX falling for 15, with money flow positive for 8 and price still resting on its 20-week average. The trade setup is in its first week, with everything left to confirm, one for swing trading watchlists.
IQS Phase
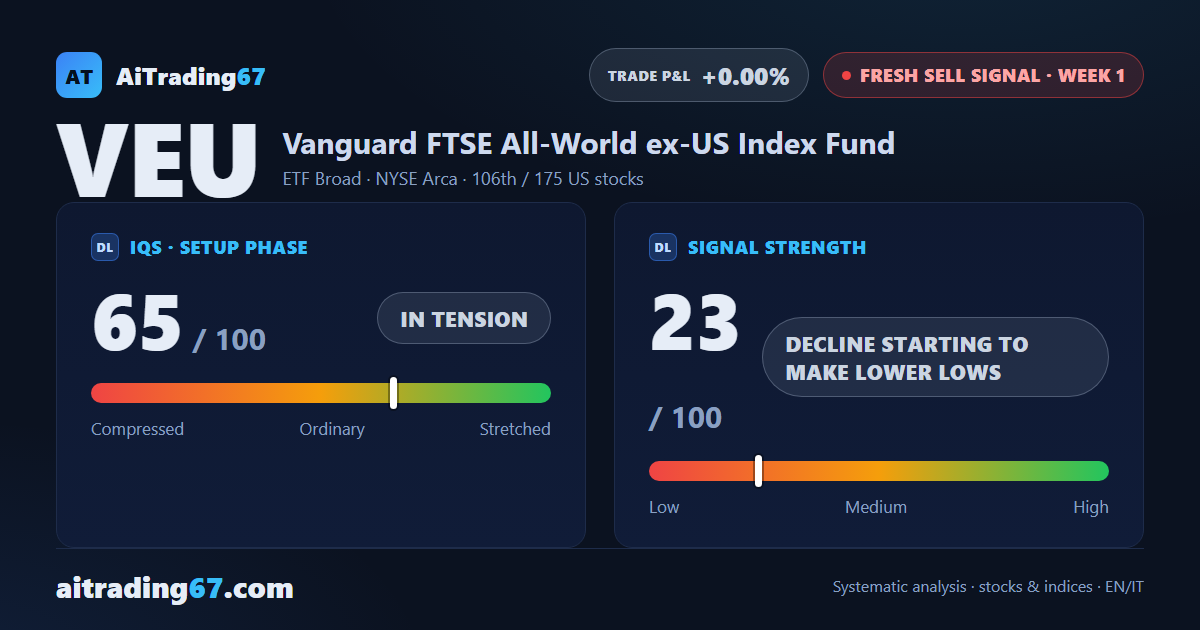
65
in tension
Signal Strength
23
decline starting to make lower lows
Sizing
MINIMUM
Ranking
#106 / 175
New us stocks
Trade P&L %
+0.00%
from signal to date, no stop loss
VEU World ex US weekly chart — EMA50 · MACD · VWAP
Weekly chart · EMA50 · MACD · VWAP · Source: TradingView
Rank position
ranks 106th among the 175 sell signals for US stocks in our ranking, with a signal strength of 23 out of 100.
Sector context
SectorETF Broad
Benchmark ETF—
Sector regime
Performanceweekly coming soon · monthly coming soon
VEU belongs to the etf broad sector (reference ETF ).
restricted Platinum content