
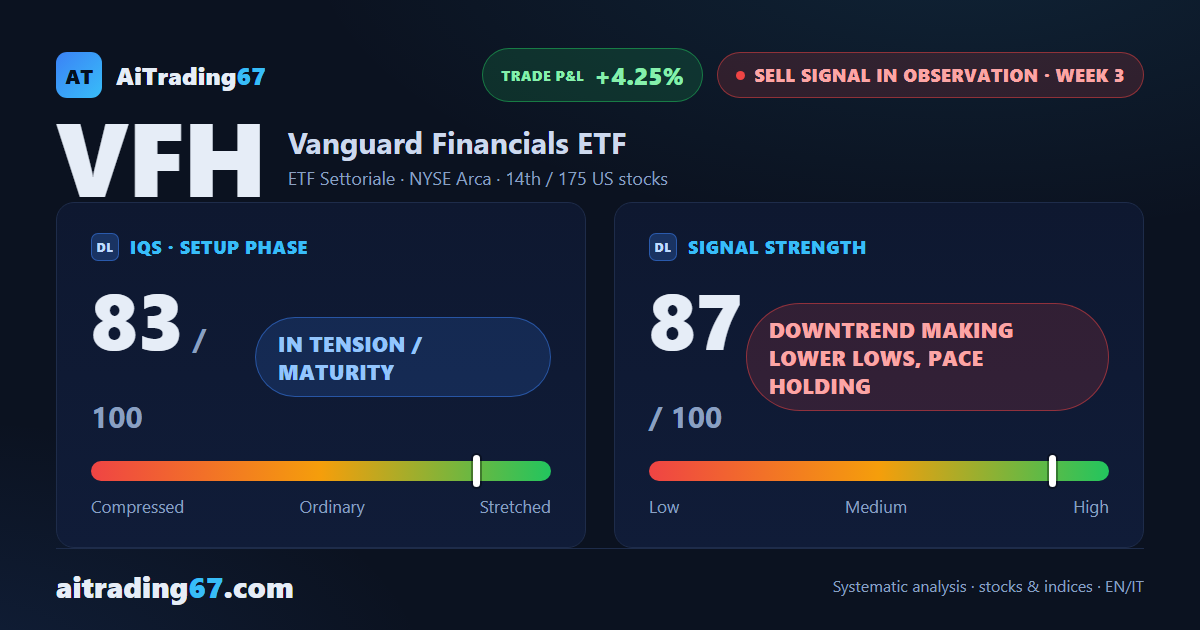
US financials ETF · Sell signal, week 3
VFH drops 2.4%, loses its 50-week average and sets a fresh 30-day low
Our view last week
The weekly MACD on VFH, the Vanguard US financial sector ETF, has dropped below its signal line for the first time in 21 weeks, and money flow has turned negative after 16 weeks above zero. The week closed down 1.9%, the third losing week in a row, with price action showing sellers in charge. In this VFH technical analysis the sell signal that fired a week ago holds its course, but the quality band advises against fresh shorts.
This week's summary
A 4th straight down week for VFH, the Vanguard US financial sector ETF: the 2.4% drop takes price below its 50-week average and to a fresh 30-day low, confirmed at the close. Last week the weekly MACD slipped under its Signal line; now the first long-term support has given way too. In this VFH technical analysis the Sell signal keeps its pace, but for swing trading a daily RSI at 27, in oversold territory, makes a technical bounce a live risk.
IQS Phase
83
in tension / maturity
Signal Strength
87
downtrend making lower lows, pace holding
Sizing
STANDARD
Ranking
#14 / 175
US stocks sell signals
Trade P&L %
+4.25%
from signal to date, no stop loss
VFH Financials US weekly chart — EMA50 · MACD · VWAP
Weekly chart · EMA50 · MACD · VWAP · Source: TradingView
Rank position
ranks 14th among the 175 sell signals for US stocks in our ranking, with a signal strength of 87 out of 100.
Sector context
SectorETF Settoriale
Benchmark ETFXLF
Sector regimeweak phase
Performanceweekly -2.46% · monthly -7.23%
VFH belongs to the etf settoriale sector (reference ETF XLF). The sector is classified weak phase according to our weekly reading.
restricted Platinum content