
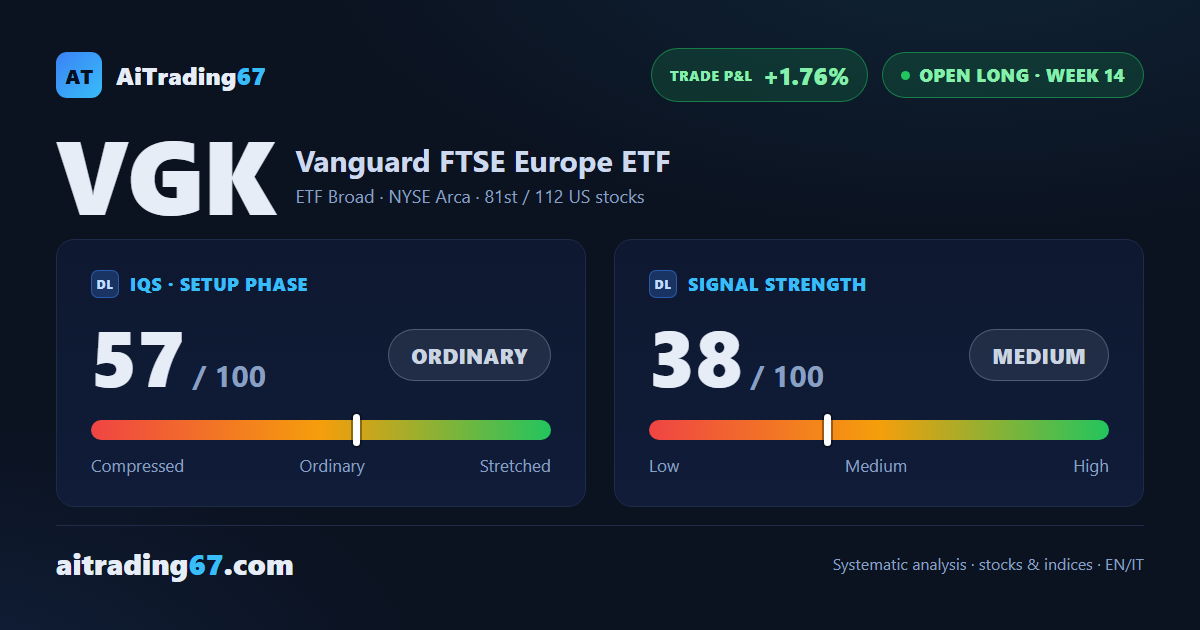
VGK, week 14: tight range, +1.76% gain
VGK closes flat (0%): the European rebound stays boxed between support and resistance
VGK, week 14: tight range, +1.76% gain
Our view last week
Vanguard FTSE Europe ETF's bounce is losing steam: after a week of dominant buying, sellers took back control with 53% of volume and money flow flipped negative again. Price is boxed into a tight band between the daily Bollinger midline in the 88.7 area and the daily pivot in the 88.5 area, above the double bottom carved out in the 87 area in prior weeks. The European basket is up 1.73% since the buy signal opened.
This week's summary
This week's technical analysis of VGK, the ETF tracking the European equity basket, tells a story of shifting volume: buyers took back control with 56% of trading, after sellers had dominated the week before. Price didn't take advantage, though, closing flat and still boxed between resistance in the 89 area and support in the 88.5 area, above the double bottom carved out in the 87 area. The trade has been open for 14 weeks and sits 1.76% in the green.
IQS Phase
57
ordinary
Signal Strength
38
medium · weak
Sizing
REDUCED
Ranking
#81 / 112
US stocks in progress
Trade P&L %
+1.76%
from signal to today
restricted Platinum content