
Tech ETF: the push has been cooling for weeks
VGT drops 4.2% but holds its double bottom as the rally loses steam for weeks
Tech ETF: the push has been cooling for weeks
Our view last week
Weekly technical analysis: Vanguard Information Technology ETF closes the week up 3.0%, with buyers dominating 97% of volume. Beneath the surface, though, the pace is cooling - the MACD histogram has narrowed for four straight weeks and money flow stays well under its mid-June highs. Price is boxed between a resistance and a support just one ATR apart, and this buy signal is in its 12th week of management, up 17.26% since opening.
This week's summary
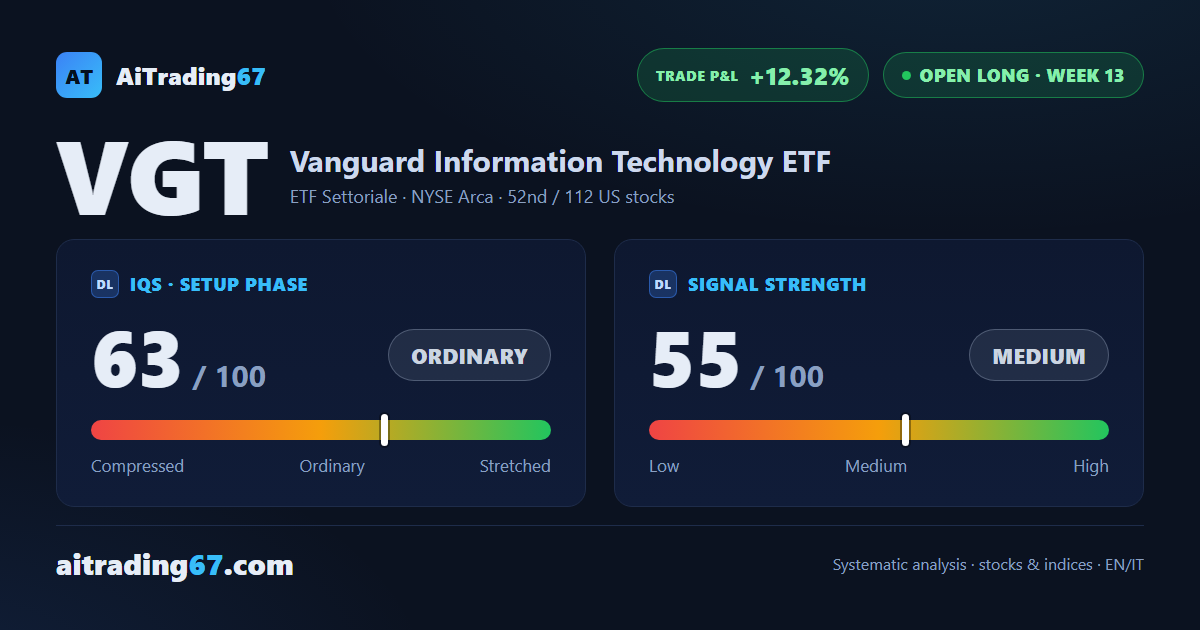
Weekly technical analysis: VGT, the Vanguard US technology sector ETF, drops 4.2% and slides into the 111 area, then bounces 10% off a clean double bottom - a sign buyers didn't fully give up. Under the surface, though, the picture has been cooling for weeks: money flow and momentum have been fading for a month, and now price is catching up with them. The trade is 13 weeks in, up 12.3%.
IQS Phase
63
ordinary
Signal Strength
55
medium
Sizing
STANDARD
Ranking
#52 / 112
US stocks in progress
Trade P&L %
+12.32%
from signal to today
restricted Platinum content