
Industrial sector, a sell signal still evolving
Vertiv rebounds 6.1% off the double bottom, but CMF still flags distribution
Industrial sector, a sell signal still evolving
Our view last week
Vertiv Holdings is in week 6 of a sell signal that has run out of momentum: the week closed down 1.1%, and signal strength has fallen to 30 out of 100, a decline losing steam. The stock ranks 50th among 137 US sell signals, with the setup quality indicator at 75 out of 100 and in tension toward maturity. Trading not recommended per our model.
This week's summary
Vertiv rebounds 6.1% this week on 61% buy volume, lifted off a double bottom near the 281 area and a 30% intermediate bounce, after a modest decline last week. But money flow (CMF) sinks to its worst reading in four weeks: the buyers' comeback doesn't fully convince yet. Price is squeezed between resistance in the 319 area and support in the 317 area, with MACD still below its signal line.
IQS Phase
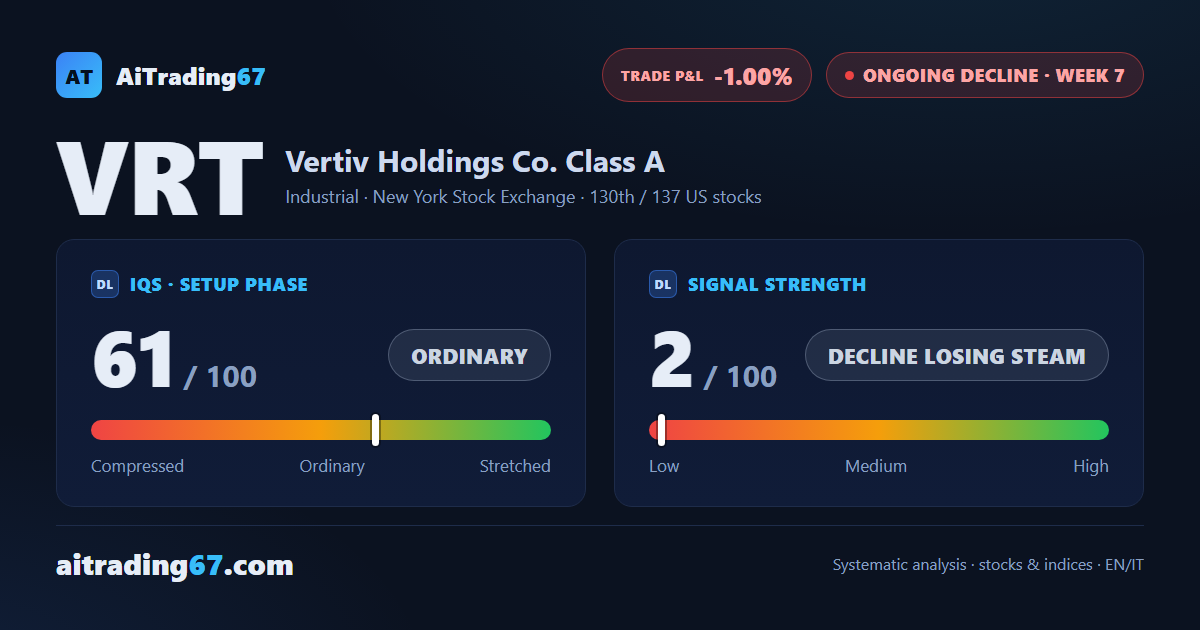
61
ordinary
Signal Strength
2
decline losing steam
Sizing
MINIMUM
Ranking
#130 / 137
US stocks
Trade P&L %
-1.00%
from signal to today
restricted Platinum content