
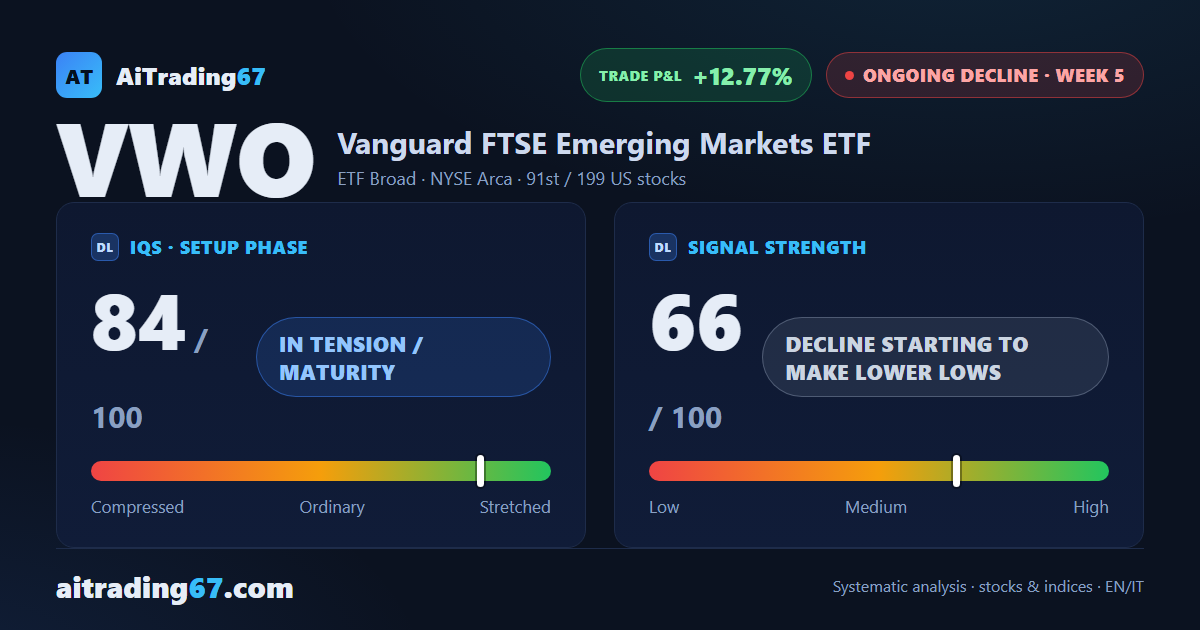
VWO emerging markets ETF: sell signal, week 4
VWO slips 0.4%: the emerging markets ETF slows its decline just above the 30-week low
Our view last week
VWO, the Vanguard emerging markets ETF, has seen weekly money flow turn negative after 23 weeks, while the price lost 2.3% and set a new 90-day low. For price action trading, the daily chart now lines up 4 lower highs, the last one stalling in the 57 area, beneath the 50-week average lost a week ago. This VWO technical analysis shows a downtrend making lower lows, pace holding; for swing trading, with the daily RSI at 26, a new short here is a high-risk opening.
This week's summary
VWO, the Vanguard emerging markets ETF, slips just 0.4% after last week's new 90-day low: the decline is slowing and lacks fresh momentum. This technical analysis still leans bearish, with money flow below zero for a second week and the MACD under its signal line for 8 weeks. For swing trading, price is boxed between the 55.3 area and the 30-week low, in the 54.2 area.
IQS Phase
73
in tension
Signal Strength
19
decline losing steam
Sizing
STANDARD
Ranking
#138 / 181
US stocks sell signals
Trade P&L %
+4.72%
from signal to date, no stop loss
VWO Emerging Markets weekly chart — EMA50 · MACD · VWAP
Weekly chart · EMA50 · MACD · VWAP · Source: TradingView
Rank position
ranks 138th among the 181 sell signals for US stocks in our ranking, with a signal strength of 19 out of 100.
Sector context
SectorETF Broad
Benchmark ETF—
Sector regime
Performanceweekly coming soon · monthly coming soon
VWO belongs to the etf broad sector (reference ETF ).
restricted Platinum content