
VXUS technical analysis: the cooldown persists
VXUS slips 2.3% as the MACD stays below its signal line
VXUS technical analysis: the cooldown persists
Our view last week
VXUS's weekly technical picture confirms the cooling in flow and momentum flagged last week: the MACD has just completed a bearish cross, even as buy-side volume swings back in the buyers' favor. On the daily chart the double bottom in the 83 area is still visible, with an 8% rebound, while price sits boxed between the first resistance and the first support, just above and below the 85 area. The capital still in play is running at +5% since entry.
This week's summary
VXUS's weekly technical analysis confirms the cooling flagged last week: the fund is down 2.3%, with 69% of volume back on the sell side and money flow negative again. The MACD stays below its signal line, with the histogram sinking further into negative territory, and RSI slips to 53.8. On the daily chart the double bottom in the 82 area still holds, with the 8% rebound still visible, while price stays boxed between the first resistance and the first support, just above and below the 84 area.
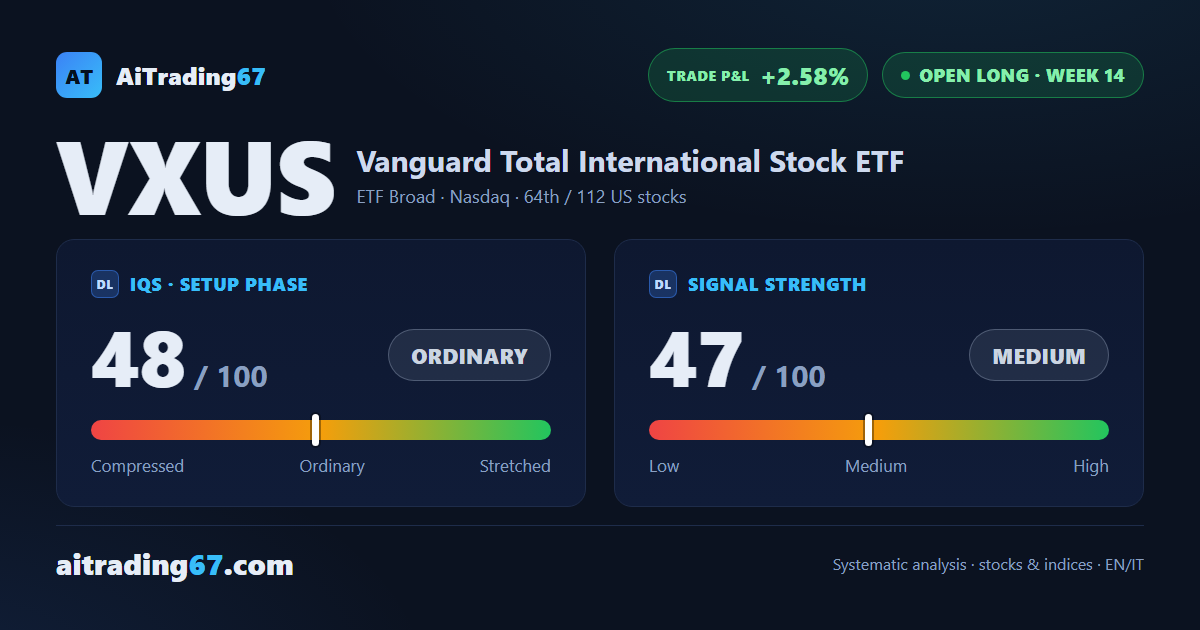
IQS Phase
48
ordinary
Signal Strength
47
medium · weak
Sizing
REDUCED
Ranking
#64 / 112
US stocks in progress
Trade P&L %
+2.58%
from signal to today
restricted Platinum content