
International stock ETF · new sell signal
VXUS slips 1.1% and a sell signal fires while the 20-week average still holds
Our view last week
After two down weeks, VXUS, the Vanguard international ex-US stock ETF, edges up 0.5%, yet this time the majority of volume, 52%, goes to sellers. VXUS technical analysis shows price penned into a tight corridor, between the 20-day average in the 86.6 area and the 50-day in the 86.3 area. Money flow has been positive for 7 weeks and the MACD is still below its Signal line: for swing trading, what matters is which way price breaks out.
This week's summary
Last week's tight corridor has broken to the downside: VXUS, the Vanguard international ex-US stock ETF, slips 1.1% and a new sell signal fires. During the week price printed a new 30-day low, in the 83.9 area, without confirming it on the close, and the 20-week average held. VXUS technical analysis and the price action describe a decline that has only just started inside a longer-term structure that is still bullish: for swing trading, a trade setup our model rates as not recommended.
IQS Phase
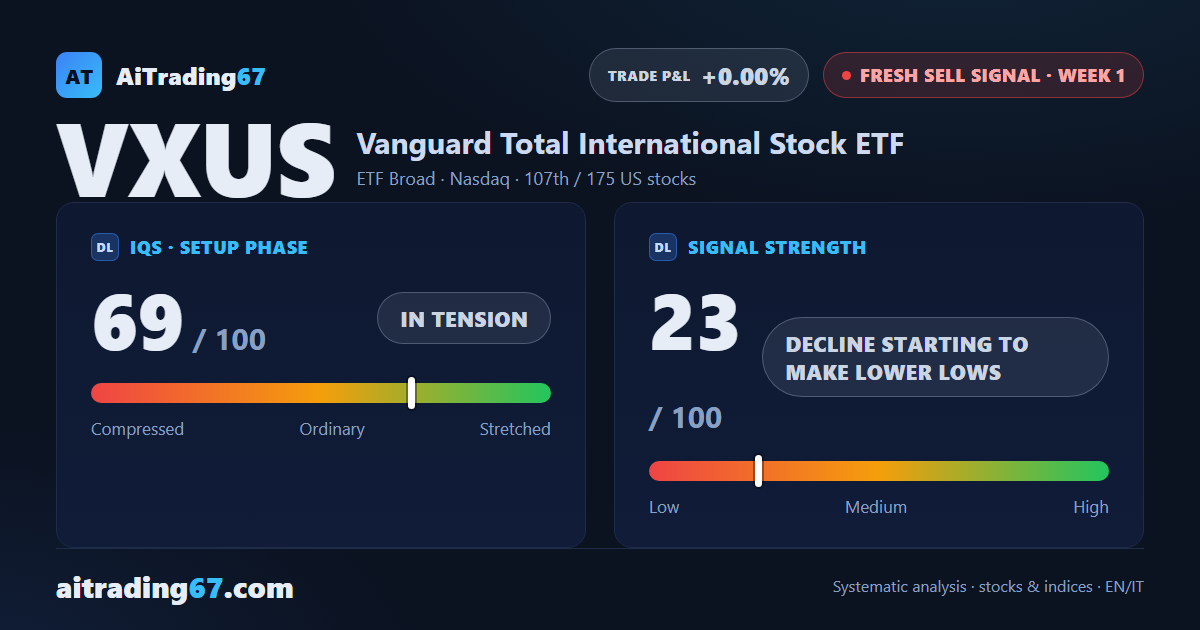
69
in tension
Signal Strength
23
decline starting to make lower lows
Sizing
MINIMUM
Ranking
#107 / 175
New us stocks
Trade P&L %
+0.00%
from signal to date, no stop loss
VXUS International Equity weekly chart — EMA50 · MACD · VWAP
Weekly chart · EMA50 · MACD · VWAP · Source: TradingView
Rank position
ranks 107th among the 175 sell signals for US stocks in our ranking, with a signal strength of 23 out of 100.
Sector context
SectorETF Broad
Benchmark ETF—
Sector regime
Performanceweekly coming soon · monthly coming soon
VXUS belongs to the etf broad sector (reference ETF ).
restricted Platinum content