
EN IT

Verizon: the decline loses steam as the technical picture stays mixed

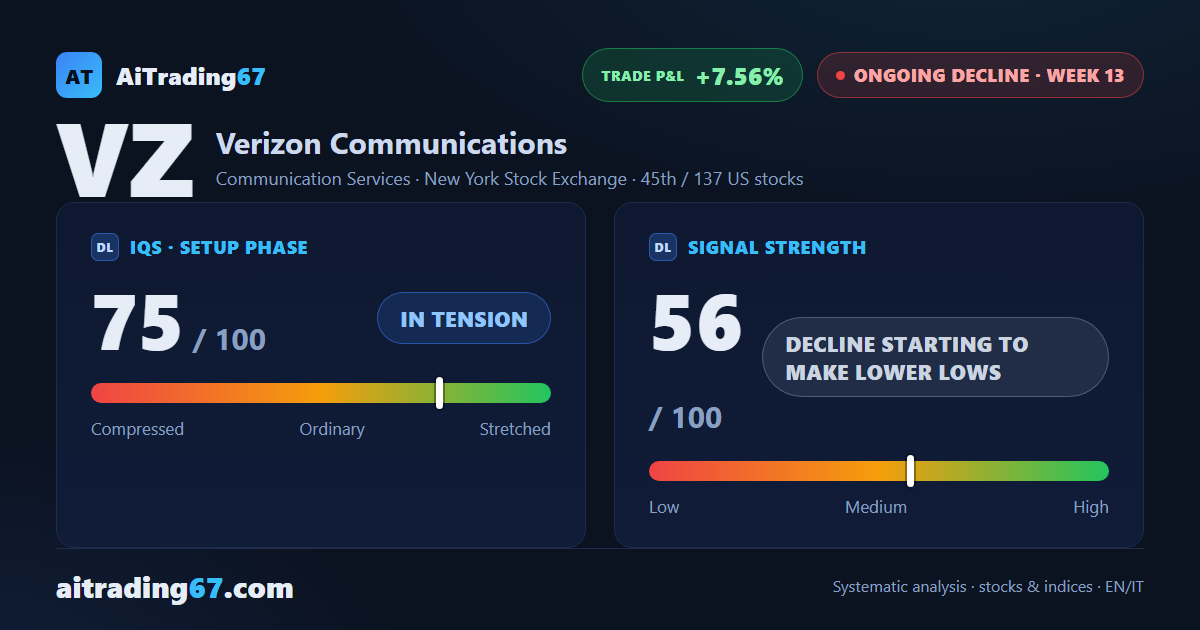
Verizon technical analysis — week 13 of a sell setup, stock performance down 8.6% this week, with CMF and the MACD histogram pointing to a decline that is starting to lose steam.

Verizon: the decline loses steam as the technical picture stays mixed
Verizon, sell week 13
Verizon: the decline loses steam as the technical picture stays mixed
July 03, 2026
Verizon, sell week 13
In Summary
Week 13 of the sell signal on Verizon, and the week closed down 8.6% after the prior week's 2.6-point recovery. The underlying technical picture, though, is telling a story of a decline losing some of its edge: the MACD histogram is improving, and CMF has only just dipped back below zero. The updated technical read on how the trade is evolving.
Ongoing decline ·13th week from start ·US stocks ·T2 ·📅 Earnings · Jul 24 ★ See Gold version →
IQS Phase
75
in tension
Signal Strength
56
decline starting to make lower lows
Sizing
STANDARD
Ranking
#45 / 137
US stocks
Trade P&L %
+7.56%
from signal to today
Chart · Weekly — EMA50 · MACD · VWAP
Weekly chart · EMA50 · MACD · VWAP · Source: TradingView
How to read this pageA visual guide to the post, card by card
The full analysis, operating plan and detailed levels on this asset are reserved for clients ★ PLATINUM
restricted Platinum content
Share WhatsApp Telegram Gmail LinkedIn