
Verizon, week 14: the decline tightens again
Verizon slips 1% as money flow sinks back negative beneath the surface
Verizon, week 14: the decline tightens again
Our view last week
Week 13 of the sell signal on Verizon, and the week closed down 8.6% after the prior week's 2.6-point recovery. The underlying technical picture, though, is telling a story of a decline losing some of its edge: the MACD histogram is improving, and CMF has only just dipped back below zero. The updated technical read on how the trade is evolving.
This week's summary
Verizon slipped just 1% this week, but the picture underneath tells a different story: the decline is tightening again, with money flow sinking back negative and the weekly MACD back in negative territory. Last week's read suggested the move was losing its edge; now it's turning serious again. On the daily chart a clean double bottom in the 41 area gave a 7% rebound, with the RSI near oversold — a brief respite inside a decline that, with the ADX climbing, is regaining conviction.
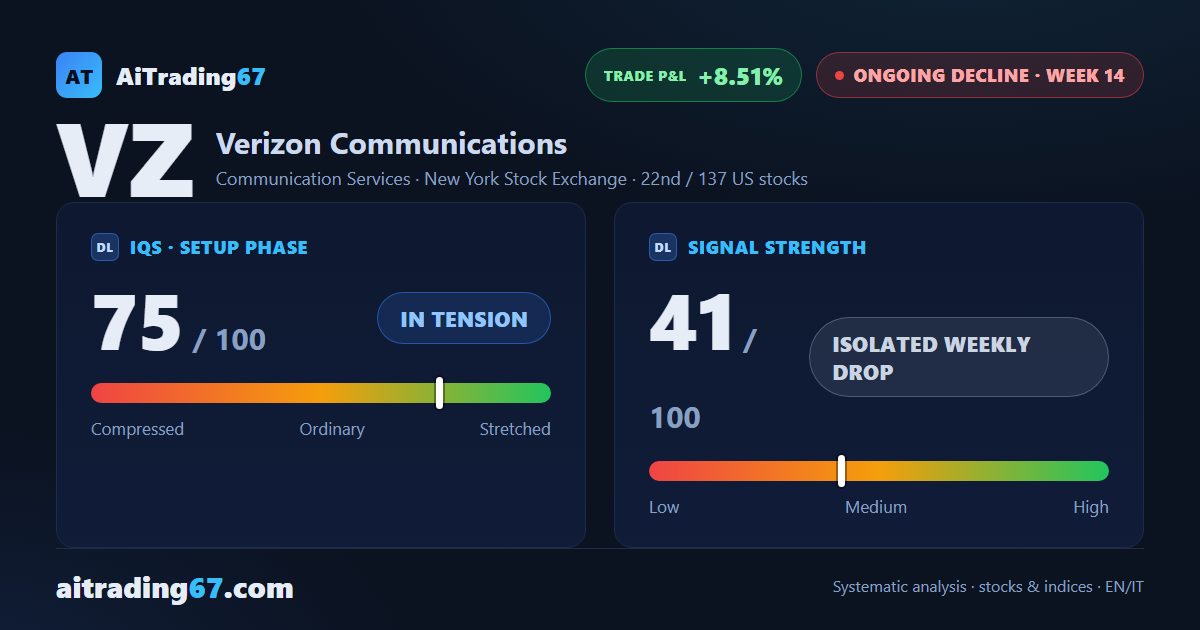
IQS Phase
75
in tension
Signal Strength
41
isolated weekly drop
Sizing
REDUCED
Ranking
#22 / 137
US stocks
Trade P&L %
+8.51%
from signal to today
restricted Platinum content