
Sell signal under management, decline losing steam
Verizon climbs 6.4% as its sell signal shows the first cracks
Sell signal under management, decline losing steam
Our view last week
Verizon adds another 3.5% this week, extending the rebound that began with the double bottom in the 41 area: the price is boxed between the 20-day moving average and the daily Bollinger Band above, and the daily VWMA below. The weekly RSI has climbed back toward 45, far from last week's near-oversold level, but money flow stays negative and the distribution phase keeps going: the decline hasn't loosened its grip yet. Verizon stock remains a case worth following in this week's technical analysis.
This week's summary
Verizon stock adds another 6.4% and closes with 98% of volume on the buy side: the double bottom in the 41 area keeps holding, and money flow, negative for three weeks, has turned positive. The sell signal stays live, but the weekly RSI climbs above 51, its highest reading in four weeks: the first cracks in the decline are piling up. Our technical analysis keeps following Verizon week after week.
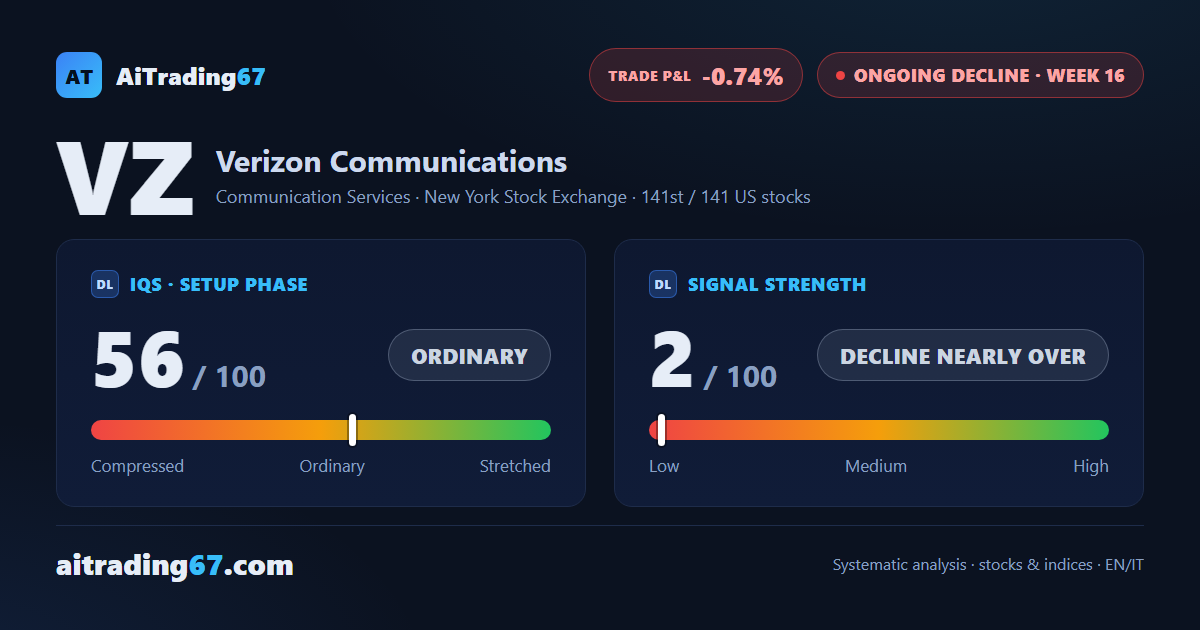
IQS Phase
56
ordinary
Signal Strength
2
decline nearly over
Sizing
MINIMUM
Ranking
#141 / 141
US stocks
Trade P&L %
-0.74%
from signal to today
Rank position
ranks 141st among the 141 sell signals for US stocks in our ranking, with a signal strength of 2 out of 100.
Sector context
SectorCommunication Services
Benchmark ETFXLC
Sector regimeweak phase
Performanceweekly -3.93% · monthly -0.23%
VZ belongs to the communication services sector (reference ETF XLC). The sector is classified weak phase according to our weekly reading.
restricted Platinum content