
Sell signal, week 19
Walmart drops 3.4%: stalled below the 50-day average, it is back on the 100-week average
Our view last week
Walmart stock gains 1.2% and sellers loosen their grip: after a week with 84% of the trade on the sell side, this one closed at 63%. The price stays pinned between the 50-day moving average, in the 109.8 area, and the 20-day moving average, in the 107.9 area, with the Inversion Point just above, in the 110.6 area. In this weekly technical analysis the price action is still in distribution, money flow has been negative for 14 weeks and the short stands at +6.7% since entry.
This week's summary
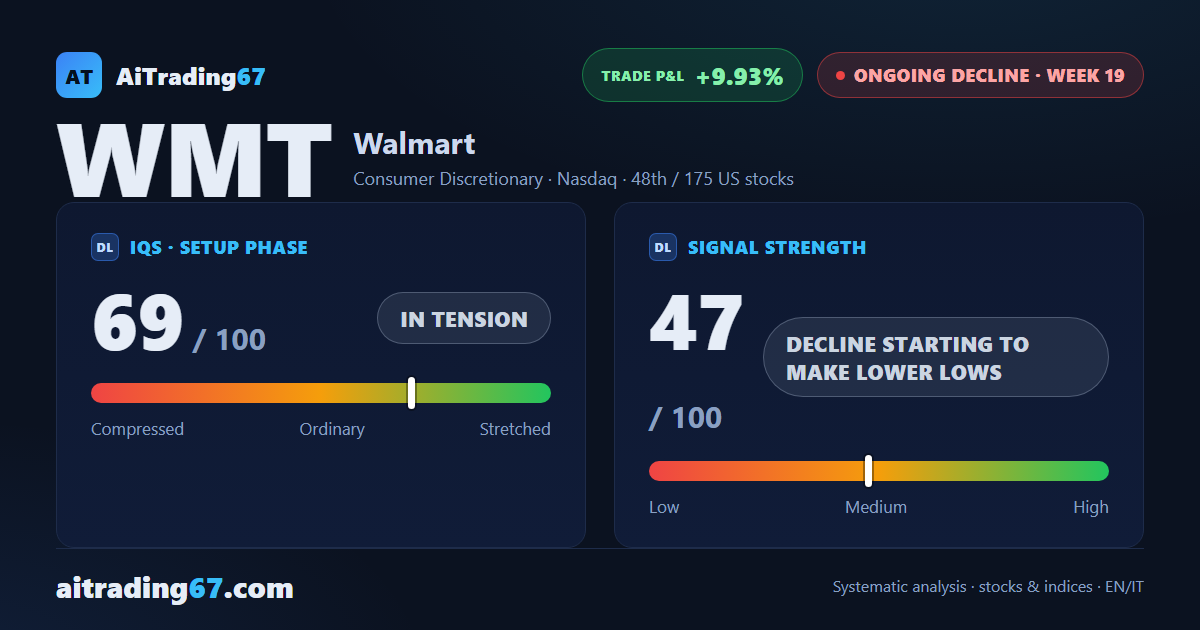
Last week's recovery found no follow-through: Walmart lost 3.4% after stalling below its 50-day moving average, in the 109 area, and is back next to the 100-week average, in the 104 area. In this weekly technical analysis Walmart stock shows money flow negative for 15 weeks, now at its lowest reading in 4, and price action in a distribution phase. The one counterweight is the MACD histogram, rising for 5 weeks. Among US stocks on a sell signal, this short stands at +9.9% since entry.
IQS Phase
69
in tension
Signal Strength
47
decline starting to make lower lows
Sizing
REDUCED
Ranking
#48 / 175
US stocks
Trade P&L %
+9.93%
from signal to date, no stop loss
Walmart (WMT) weekly chart — EMA50 · MACD · VWAP
Weekly chart · EMA50 · MACD · VWAP · Source: TradingView
Rank position
ranks 48th among the 175 sell signals for US stocks in our ranking, with a signal strength of 47 out of 100.
Sector context
SectorConsumer Discretionary
Benchmark ETFXLY
Sector regimeweak phase
Performanceweekly -0.47% · monthly -4.20%
WMT belongs to the consumer discretionary sector (reference ETF XLY). The sector is classified weak phase according to our weekly reading.
restricted Platinum content