
Wells Fargo, week 7: the signal is cooling off
Wells Fargo slips 1.4% as the buy signal cools in its seventh week
Wells Fargo, week 7: the signal is cooling off
Our view last week
Wells Fargo closes the week up 0.4%, boxed between the daily upper Bollinger Band resistance, in the 89.1 area, and the 20-day moving average support, in the 85.6 area. The buy signal is losing steam: signal strength drops to 47 out of 100, with soft buying volume and daily money flow still slightly negative. The trade, in its sixth week, has already cleared 2 of the 3 price targets, up more than 6.8%.
This week's summary
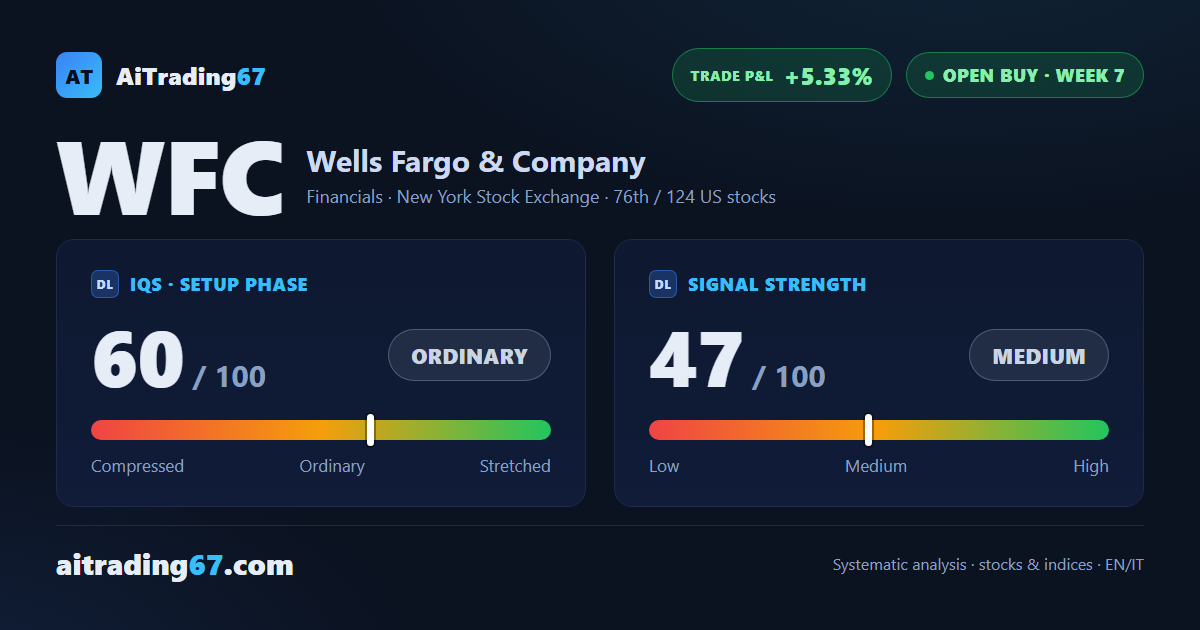
Wells Fargo weekly technical analysis: the stock slips 1.4% this week and stays boxed between the daily upper Bollinger Band, in the 89 area, and the cluster of moving averages just under 86. The buy signal is losing steam: signal strength drops to 47 out of 100, with candle bodies weakening and sellers slightly prevalent on the last bar. The trade is still in the money, up more than 5% since entry.
IQS Phase
60
ordinary
Signal Strength
47
medium · weak
Sizing
REDUCED
Ranking
#76 / 124
US stocks in progress
Trade P&L %
+5.33%
from signal to today
Rank position
ranks 76th among the 124 Longs already running for US stocks in our ranking, with a signal strength of 47 out of 100.
Sector context
SectorFinancials
Benchmark ETFXLF
Sector regimein positive regime
Performanceweekly +0.09% · monthly +4.82%
WFC belongs to the financials sector (reference ETF XLF). The sector is classified in positive regime according to our weekly reading.
restricted Platinum content