
Double bottom stalls the decline
Walmart bounces 1.8%, decline stalls at a double bottom in the 109 area
Double bottom stalls the decline
Our view last week
Walmart is in week 6 of a sell signal, and this week gave up 3.3%: strength drops to 51 out of 100, a decline advancing on lower lows, not a move running out of steam. The setup quality indicator sits at 68 out of 100, in tension, and the stock ranks 70th among the 137 US sell signals. The quality band remains trading not recommended.
This week's summary
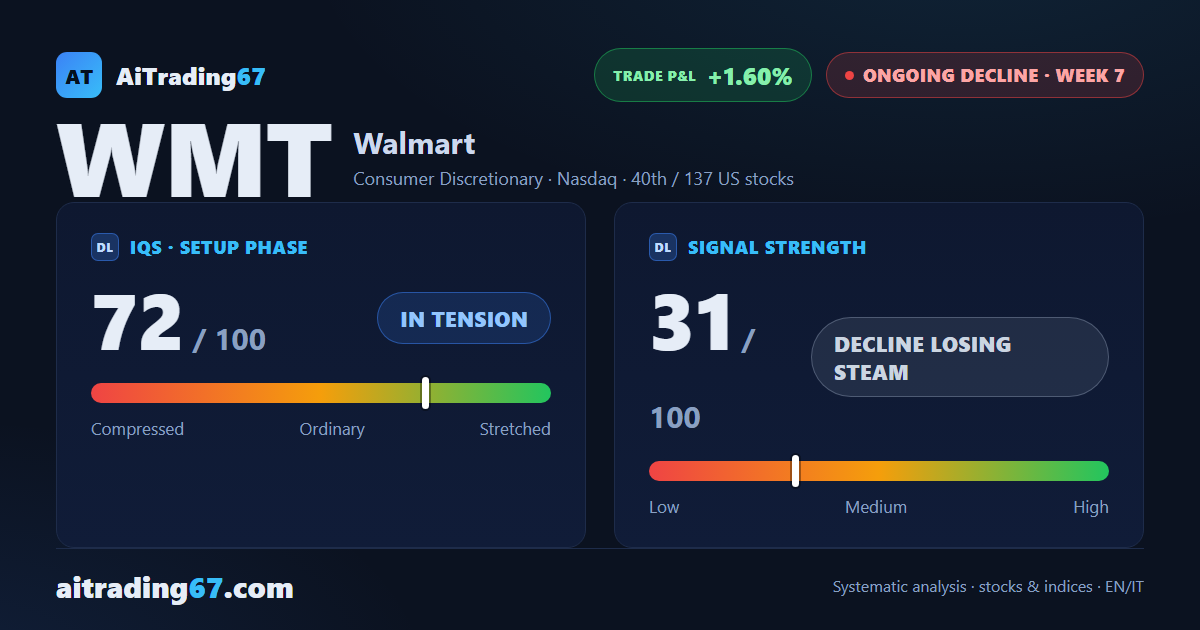
Walmart bounced 1.8% this week, carving out a clean double bottom on the daily chart in the 109 area, with almost all of the week's volume on the buy side. The short on the sell signal remains in profit, roughly 1.6% since entry. A week ago the decline was still making lower lows; the pace has now paused — and weekly money flow stays negative, with momentum still stuck.
IQS Phase
72
in tension
Signal Strength
31
decline losing steam
Sizing
REDUCED
Ranking
#40 / 137
US stocks
Trade P&L %
+1.60%
from signal to today
restricted Platinum content