
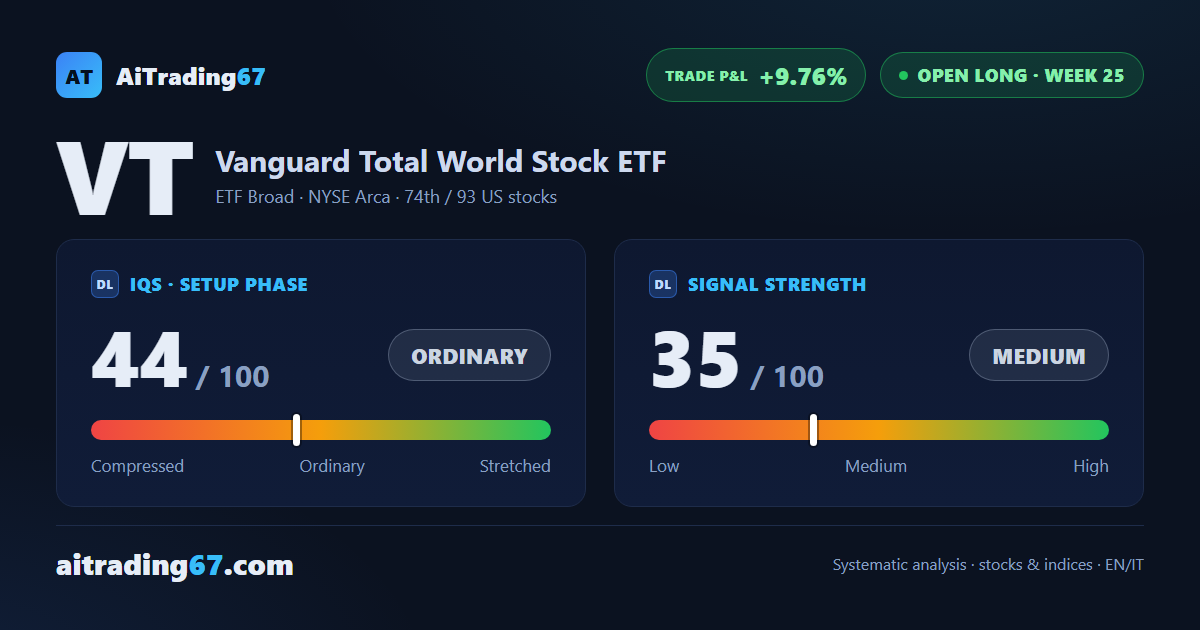
Global equity ETF · open long, week 25
VT slips 0.6% yet closes near the week's high as the 20-week average holds
Our view last week
VT, the Vanguard ETF on the whole global stock market, gains 0.9% and wins back last week's loss, close to its all-time high in the 163 area. VT technical analysis shows a rally without drive: money flow is rising and has been positive for 19 weeks, yet buyers drop to 54% of the trade and the MACD has stayed below its Signal for 3 weeks. Weekly price action is bearish, and among our weekly buy signals still running the trade is up 10.4%.
This week's summary
VT, the Vanguard global stock ETF, slips 0.6% after last week's recovery, yet closes in the upper part of its range: during the week it dipped to its 20-week moving average, in the 157 area, which held. VT technical analysis stays split: money flow climbs to its highest reading in a month, while the MACD has been below its Signal for 4 weeks and the ADX has fallen for 5. Price action is indecisive close to the all-time high; among our weekly buy signals still running, the trade is up 9.8%.
IQS Phase
44
ordinary
Signal Strength
35
medium · weak
Sizing
REDUCED
Ranking
#74 / 93
US stocks in progress
Trade P&L %
+9.76%
from signal to date, no stop loss
World Stocks (VT) weekly chart — EMA50 · MACD · VWAP
Weekly chart · EMA50 · MACD · VWAP · Source: TradingView
Rank position
ranks 74th among the 93 Longs already running for US stocks in our ranking, with a signal strength of 35 out of 100.
Sector context
SectorETF Broad
Benchmark ETF—
Sector regime
Performanceweekly coming soon · monthly coming soon
VT belongs to the etf broad sector (reference ETF ).
restricted Platinum content