
TeraWulf, the sell signal bites again
TeraWulf drops 17.3% as the sell signal regains momentum
TeraWulf, the sell signal bites again
Our view last week
After an isolated 18% plunge last week, TeraWulf bounces 3.7% and the sell signal stalls without a fresh low: the push has lost steam, and signal strength drops from 100 to 40 out of 100. Volume tells another story — only 8% of last session traded on the buy side — and with the stock still more than 134% above its 200-week average, our model flags it as high risk: trading not recommended.
This week's summary
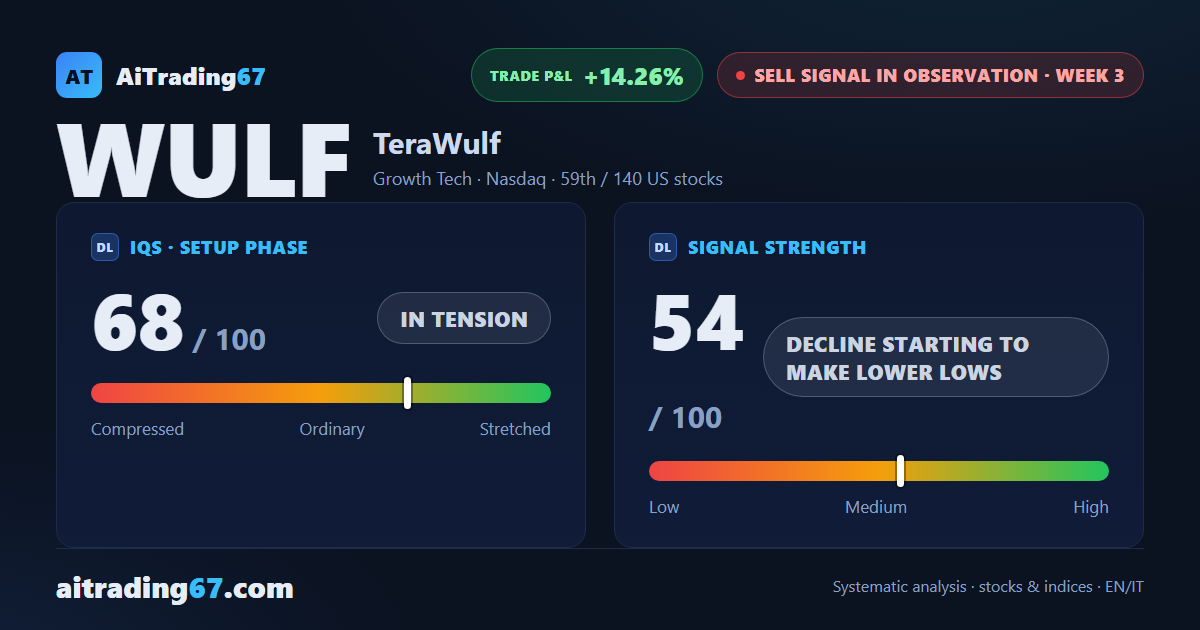
This week's technical analysis on TeraWulf shows a clean double bottom in the 19 area on the daily chart, with a 32% intraweek rebound — yet the week still closed down 17.3% and the sell signal is picking up steam: signal strength climbs to 54 out of 100, "downtrend making lower lows, pace holding." Sellers remain in charge, though fading, and TeraWulf stock stays 92% above its 200-week average: our model flags trading as not recommended.
IQS Phase
68
in tension
Signal Strength
54
decline starting to make lower lows
Sizing
STANDARD
Ranking
#59 / 140
US stocks sell signals
Trade P&L %
+14.26%
from signal to today
restricted Platinum content