
Sell signal · week 2 · trading not recommended
XLG under pressure, but double bottom stalls the decline
Sell signal · week 2 · trading not recommended
In Summary
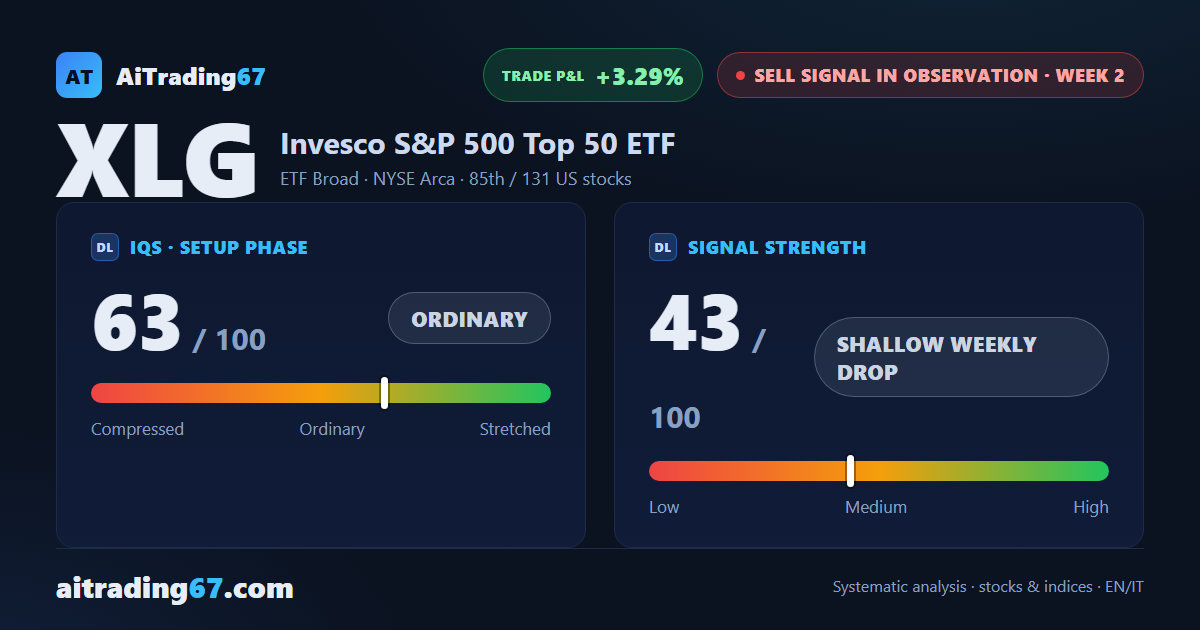
The Invesco S&P 500 Top 50 ETF is in week 2 of a sell signal, with a 3.29% gain since the signal opened. The weekly structure remains intermediate bearish, but on the daily chart a double bottom is forming in the 60 area with a 6% rebound — a note of caution that deserves attention. The quality band signals trading not recommended: the price is still 26.6% above the 200-week moving average. The ETF sits 85th among 131 US sell signals in our ranking.
IQS Phase
63
ordinary
Signal Strength
43
shallow weekly drop
Sizing
REDUCED
Ranking
#85 / 131
US stocks sell signals
Trade P&L %
+3.29%
from signal to today
restricted Platinum content