
The rebound continues, the sell signal stays unconfirmed
XLG gains 2.1% and extends its rebound, the sell signal still unconfirmed
The rebound continues, the sell signal stays unconfirmed
Our view last week
XLG is in the 4th week of a sell signal, and the three observation weeks closed sideways: the decline never found confirmation in the market. The week just closed recovered 2.4%, with signal strength holding at 43 out of 100 — an isolated weekly drop, not a steady-paced move. XLG ranks 73rd among the 137 US sell signals, in a band our model still flags as not recommended for trading.
This week's summary
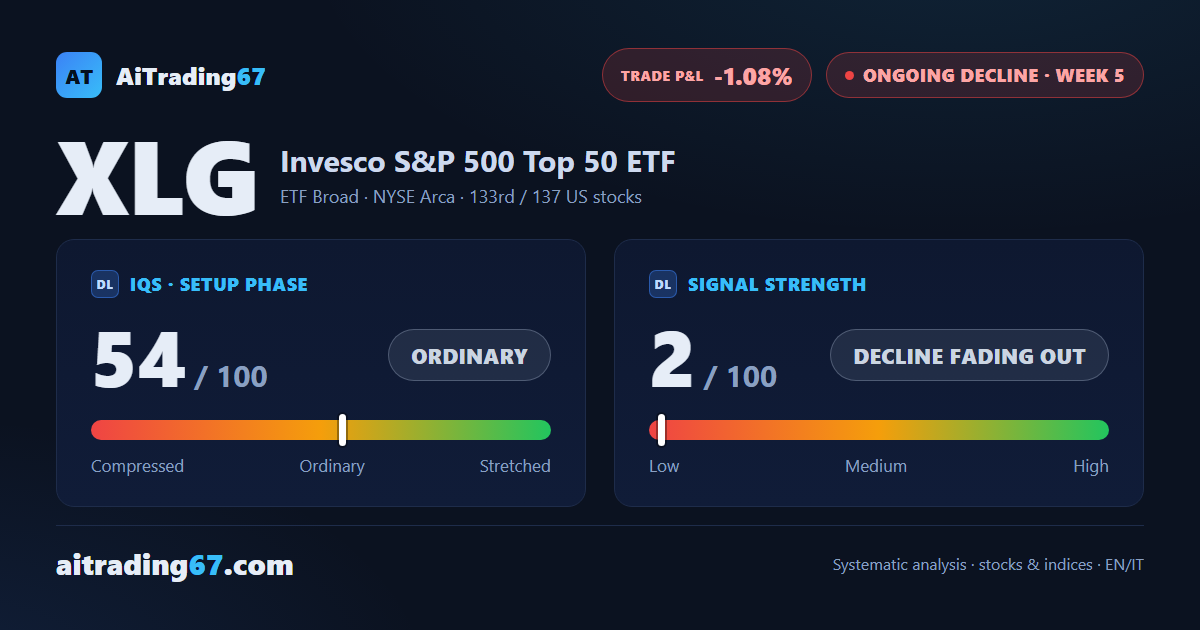
Weekly technical analysis. On XLG the buyers are back in charge: the rebound off the daily EMA20, in the 61 area, adds another 2.1% to the week, with almost all the trading on the buy side. It's the second straight recovery week for the sell signal, which still hasn't been confirmed by the market — but under the surface money flow has faded and momentum keeps slipping: it's still a stalemate, waiting for a real turn.
IQS Phase
54
ordinary
Signal Strength
2
decline fading out
Sizing
MINIMUM
Ranking
#133 / 137
US stocks
Trade P&L %
-1.08%
from signal to today
restricted Platinum content