
Buy signal in its 9th week, strength fading
XLP slips 1.2%, pinned between its 20- and 50-day averages
Buy signal in its 9th week, strength fading
Our view last week
XLP carved out a clean double bottom in the 82 area, with an intermediate 6% rebound, and this week it added 1.3%, pressing back toward the daily Bollinger Band's upper edge. The picture stays mixed, though: only 16% of yesterday's volume was on the buy side, and daily money flow is still negative. The buy signal, now in its eighth week, is running with a modest 0.46% gain.
This week's summary
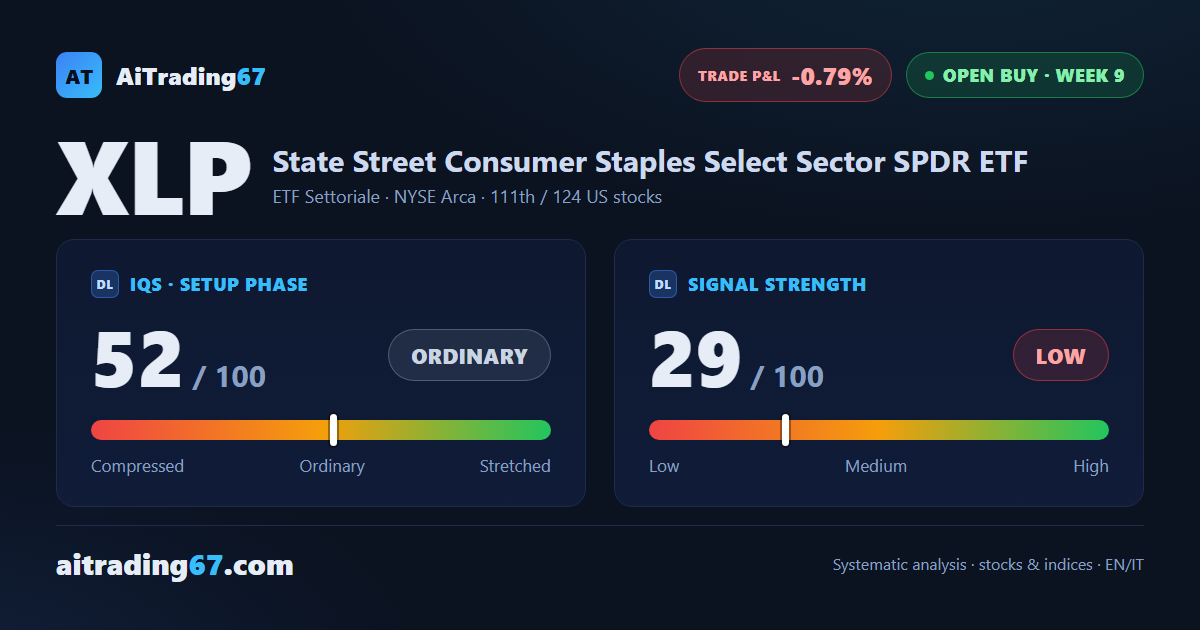
XLP closes the week down 1.2%, boxed into a tight band between its 20-day average (the 84.19 area) and its 50-day average (the 84.05 area): a squeeze that speaks to indecision. Buyers dominated 86% of yesterday's volume, yet daily money flow stays negative - a mixed signal. In our XLP technical analysis, the buy signal is now in its 9th week, with strength down to 29 out of 100: weak conviction, fading.
IQS Phase
52
ordinary
Signal Strength
29
low · fading
Sizing
MINIMUM
Ranking
#111 / 124
US stocks in progress
Trade P&L %
-0.79%
from signal to today
Rank position
ranks 111th among the 124 Longs already running for US stocks in our ranking, with a signal strength of 29 out of 100.
Sector context
SectorETF Settoriale
Benchmark ETFXLP
Sector regimeweak phase
Performanceweekly -1.24% · monthly -0.37%
XLP belongs to the etf settoriale sector (reference ETF XLP). The sector is classified weak phase according to our weekly reading.
restricted Platinum content