
XLRE: momentum cooling under a nearby resistance
XLRE slips 0.5% as momentum keeps cooling under a nearby resistance
XLRE: momentum cooling under a nearby resistance
Our view last week
XLRE is in week 12 of a buy trade that has already completed the model's coverage: all 3 price references have been hit, and the stop now trails the Inversion Point, in the 43 area. The trade is up 4.34% since entry. On the technical side, the week just closed shows momentum cooling off versus prior weeks, with a double bottom in the 43 area that has already produced a 6% rebound.
This week's summary
Weekly technical analysis. The momentum cooling flagged last week on XLRE is holding: the week just closed slips 0.5%, with sellers back slightly ahead on volume and money flow down sharply from last week's peak. Momentum, down from 2.5 three weeks ago to 0.6, has stayed flat for two weeks, and the MACD histogram keeps narrowing. Price is still working the corridor between the double bottom in the 43 area and resistance just above 44.5.
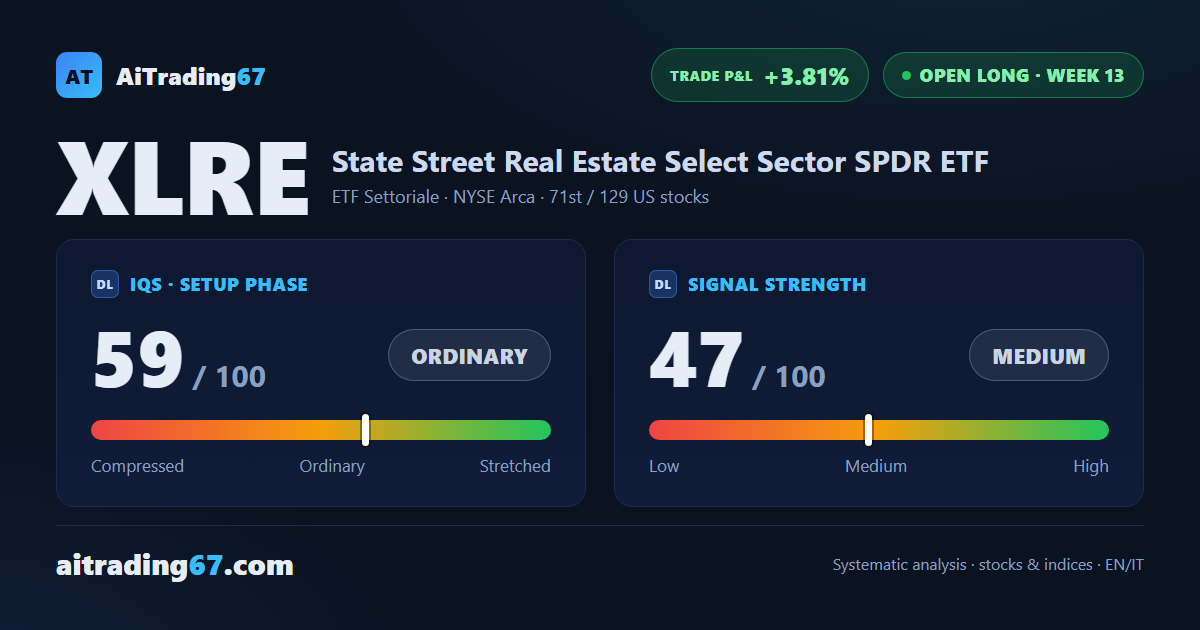
IQS Phase
59
ordinary
Signal Strength
47
medium · weak
Sizing
REDUCED
Ranking
#71 / 129
US stocks in progress
Trade P&L %
+3.81%
from signal to today
restricted Platinum content