EN IT

State Street Utilities — 5 weeks into sell signal, sideways with tight resistance overhead

State Street Utilities weekly sell signal, week 5: technical analysis shows 3 sideways weeks with buyer dominance, but the initial decline holds. Trade setup remains at elevated risk per our model.

State Street Utilities — 5 weeks into sell signal, sideways with tight resistance overhead
Sell signal in progress
State Street Utilities — 5 weeks into sell signal, sideways with tight resistance overhead
June 19, 2026
Sell signal in progress
In Summary
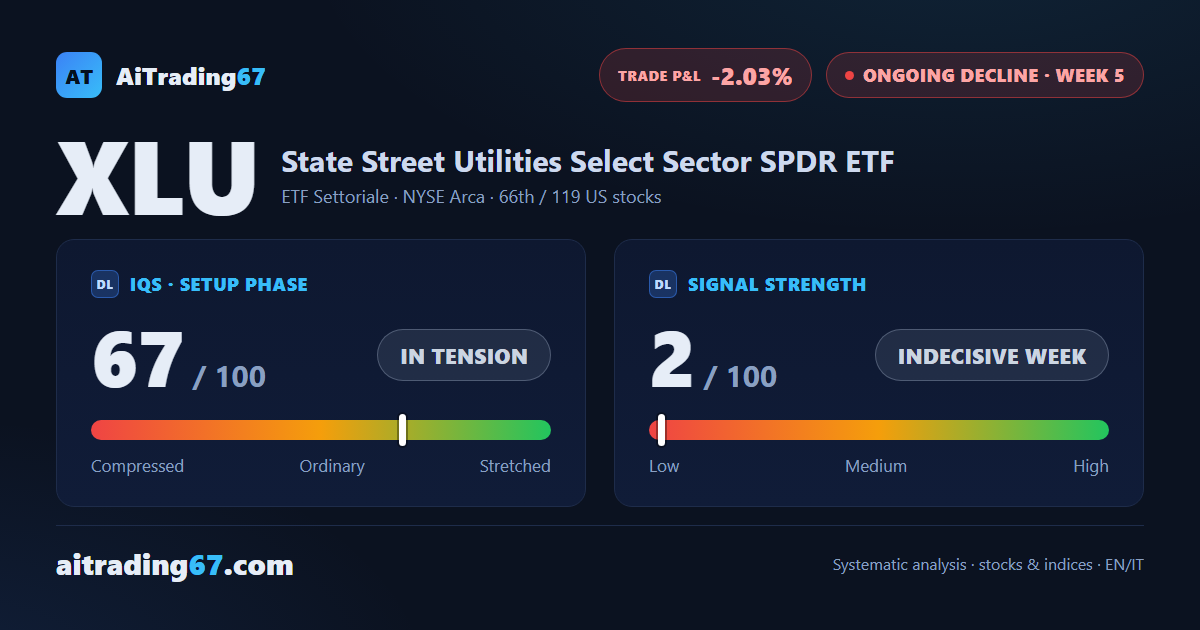
State Street Utilities is in week 5 of a sell signal that never found confirmation over the three observation weeks: the initial decline was there, but the market then shifted into a sideways pattern with buyer dominance. The quality band flags elevated risk per our model — the stock remains more than 15% above its 200-week moving average — and the trade stands at −2% from entry.
Ongoing decline ·5th week from start ·US stocks ·T2 ★ See Gold version →
IQS Phase
67
in tension
Signal Strength
2
indecisive week
Sizing
MINIMUM
Ranking
#66 / 119
US stocks
Trade P&L %
-2.03%
from signal to today
Chart · Weekly — EMA50 · MACD · VWAP
Weekly chart · EMA50 · MACD · VWAP · Source: TradingView
How to read this pageA visual guide to the post, card by card
The full analysis, operating plan and detailed levels on this asset are reserved for clients ★ PLATINUM
restricted Platinum content
Share WhatsApp Telegram Gmail LinkedIn