
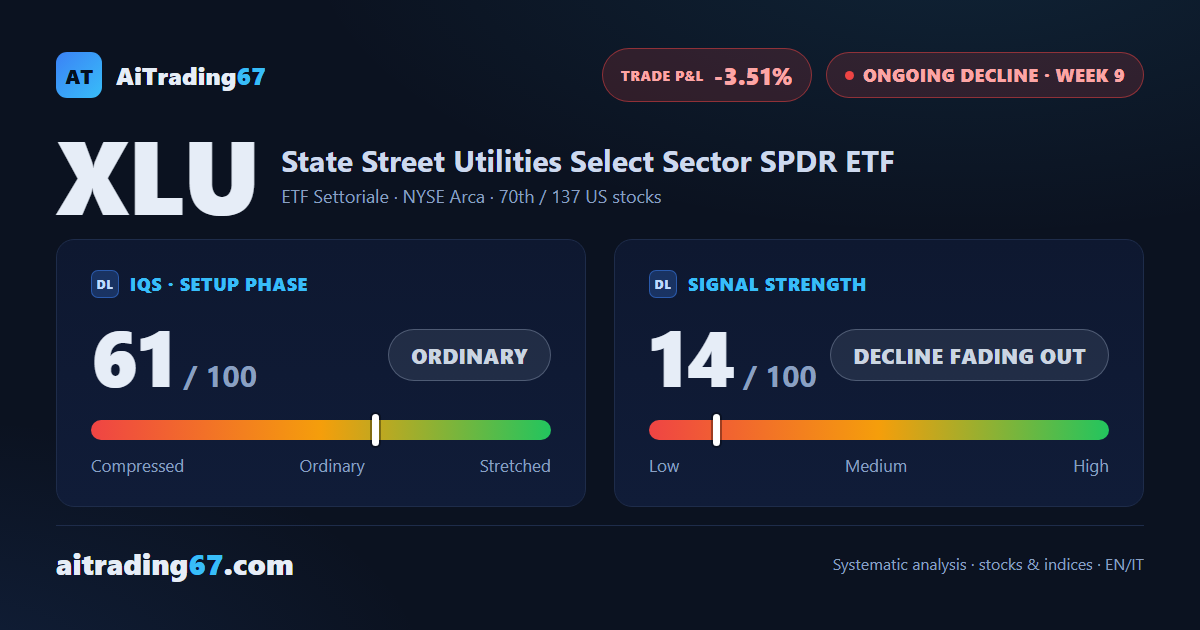
US Utilities ETF · sell signal, week 9
XLU slips 0.8%: sellers retake the majority, but a double bottom emerges
US Utilities ETF · sell signal, week 9
Our view last week
XLU is in the eighth week of a sell signal, and the week just closed down 1.0% with sell volume back in the majority. The picture stays mixed though: the price is trading close to its record highs, just 4.5% below that level, and daily cash flow is still buying. Little room to run before the next resistance, but no clear breakdown either.
This week's summary
Weekly technical analysis. The US utilities sector basket (XLU) carved a double bottom in the 43 area this week, with a 4% intermediate rebound — but the week's balance stayed negative, -0.8%, and sell volume moved back into the majority at 71%. Daily money flow, buying last week, has just turned negative, while price sits boxed between resistance and support, a step from its record highs. The sell signal, under management since its ninth week, is still down 3.5%.
IQS Phase
61
ordinary
Signal Strength
14
decline fading out
Sizing
MINIMUM
Ranking
#70 / 137
US stocks
Trade P&L %
-3.51%
from signal to today
restricted Platinum content