
XLV retests its double bottom, warning signs ease
XLV closes flat (+0.2%) and repeats its double bottom in the 150 area
XLV retests its double bottom, warning signs ease
Our view last week
Health Care remains in a strength phase, but XLV gave back 1.8% this week: the weekly picture still leans bullish, yet three warnings stand out — thinning candle bodies, collapsing buyer dominance, sellers ruling the last bar — while the daily chart shows a double bottom in the 147 area with a 7% rebound. The trade is in its 6th week, running +7.6% since entry, with signal strength down to 35 out of 100 and the pace now steadier.
This week's summary
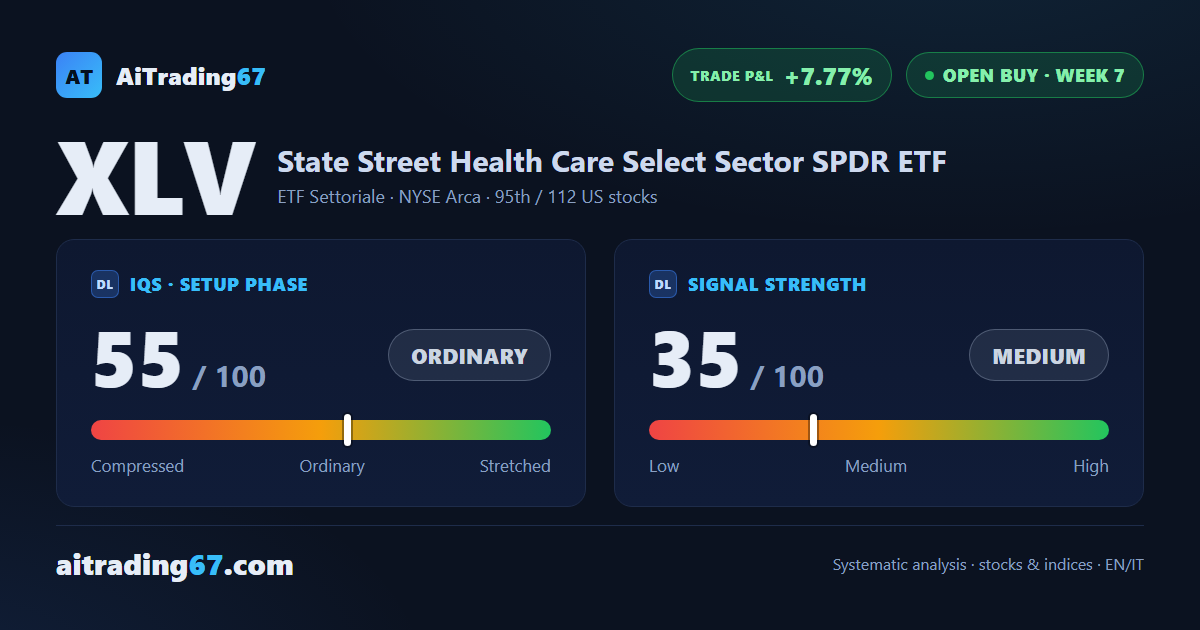
After last week's 1.8% pullback, XLV — the US Health Care sector ETF — closes this week almost flat (+0.2%) and retraces another double bottom, this time in the 150 area with a 4% rebound. Weekly warning signs ease from three to two: selling pressure is loosening its grip. The buy trade is in its 7th week and is running +7.8% since entry, with signal strength holding steady at 35 out of 100.
IQS Phase
55
ordinary
Signal Strength
35
medium · weak
Sizing
REDUCED
Ranking
#95 / 112
US stocks in progress
Trade P&L %
+7.77%
from signal to today
restricted Platinum content