
XLY: sell signal stalling in week 3
XLY inches up 0.1%, pinned under resistance as the sell signal runs out of steam
XLY: sell signal stalling in week 3
Our view last week
XLY is in week 2 of a sell signal, and the week just closed gained 2.4%: signal strength drops to 16 out of 100, a decline losing steam. The setup quality indicator holds at 62 out of 100, ordinary range, and the ETF ranks 93rd among the 137 sell signals for US stocks. Trading not recommended per our model.
This week's summary
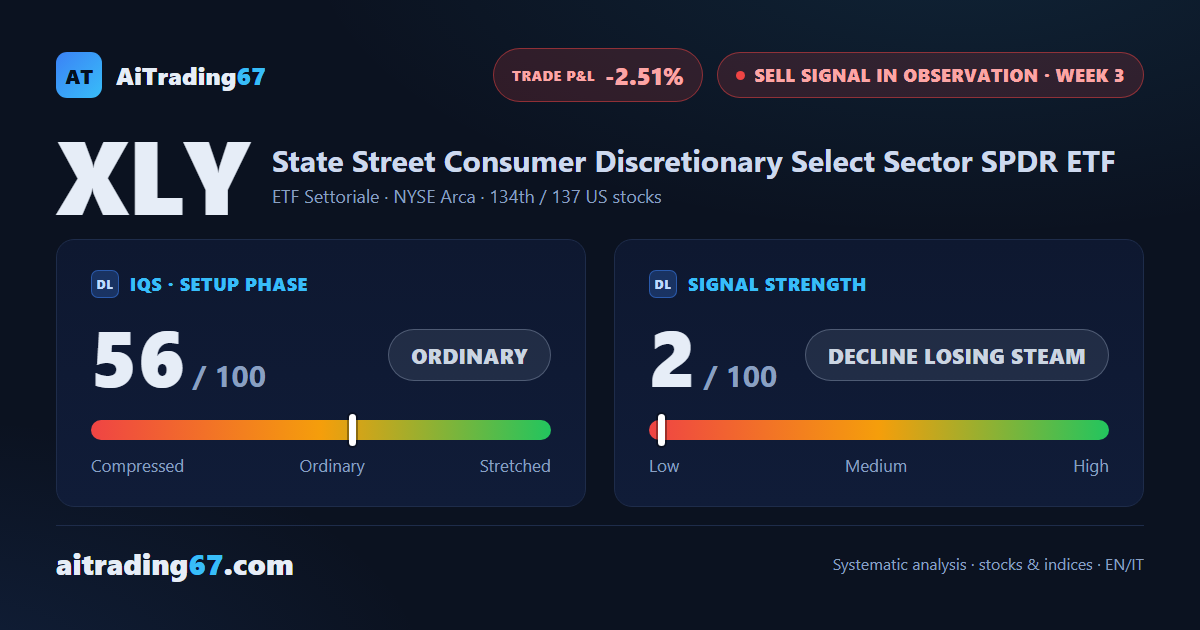
Our weekly technical analysis flags XLY's double bottom in the 113 area, which already delivered a 6% rebound: price is now pressing against resistance in the 118 area, boxed into a tight range. The sell signal is losing steam: strength drops to 2 out of 100, a decline with no fresh push, and XLY slips to 134th among the 137 US sell signals. Setup quality stays ordinary, but our model rates a fresh opening high-risk.
IQS Phase
56
ordinary
Signal Strength
2
decline losing steam
Sizing
MINIMUM
Ranking
#134 / 137
US stocks sell signals
Trade P&L %
-2.51%
from signal to today
restricted Platinum content