
Dominant sellers and a tight range on the US discretionary-sector ETF
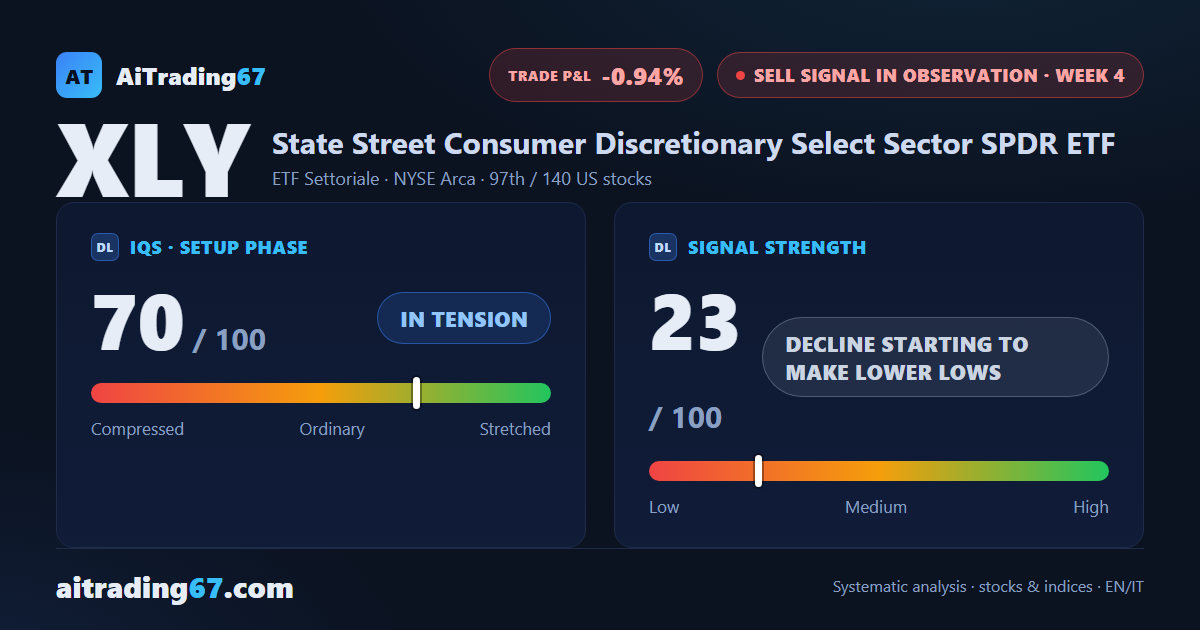
XLY slips 1.5% as the decline returns to making lower lows
Dominant sellers and a tight range on the US discretionary-sector ETF
Our view last week
Our weekly technical analysis flags XLY's double bottom in the 113 area, which already delivered a 6% rebound: price is now pressing against resistance in the 118 area, boxed into a tight range. The sell signal is losing steam: strength drops to 2 out of 100, a decline with no fresh push, and XLY slips to 134th among the 137 US sell signals. Setup quality stays ordinary, but our model rates a fresh opening high-risk.
This week's summary
XLY is still boxed into a tight range between the 115.1 and 115.8 areas, with sellers clearly dominating daily volume — buyers accounted for just 7.7% — and money flow sitting in distribution territory. The decline is back to making lower lows after weeks without fresh push, while price still sits 14.6% above the 200-week moving average: a short-term versus long-term tension our model reads as a high-risk opening.
IQS Phase
70
in tension
Signal Strength
23
decline starting to make lower lows
Sizing
MINIMUM
Ranking
#97 / 140
US stocks sell signals
Trade P&L %
-0.94%
from signal to today
restricted Platinum content