
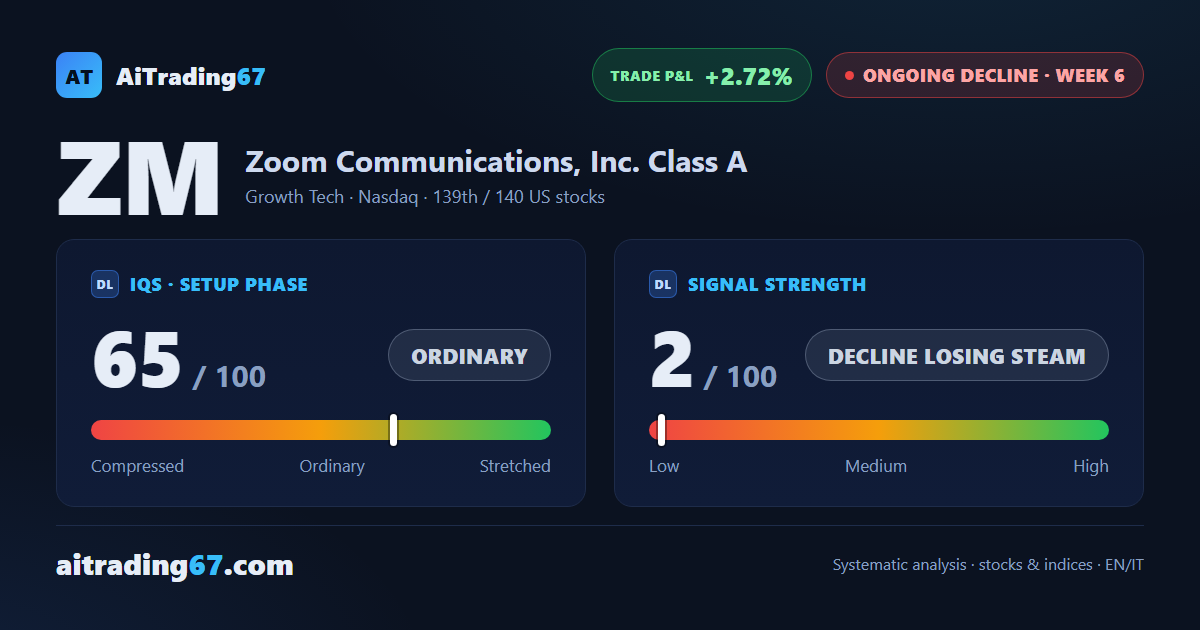
Zoom: the decline slows but money flow stays weak
Zoom rises 1.5% for a second week, but money flow keeps worsening
Zoom: the decline slows but money flow stays weak
Our view last week
Zoom stock closed the week with a 3% bounce, backed by buy volume back above 75% of trading — the first real bright spot after weeks of selling. But money flow and momentum, read in the weekly technical analysis, both worsened further, hitting a one-month low. The sell signal is now in its fifth week of management, with the short down to a 4.2% gain from 7% last week.
This week's summary
Zoom stock closed higher for a second straight week, but at a shorter stride — up 1.5% against last week's 3%. In our weekly technical analysis, money flow keeps sliding further negative and momentum keeps accelerating lower, at a one-month low. The price stays boxed into a tight band between the 91 and 94 areas.
IQS Phase
65
ordinary
Signal Strength
2
decline losing steam
Sizing
MINIMUM
Ranking
#139 / 140
US stocks
Trade P&L %
+2.72%
from signal to today
restricted Platinum content