
Sell signal in observation · week 4
Zoom gains 3.5% and reclaims its 50-week average, but the bounce stalls in the 94.5 area
Our view last week
The 1.1% bounce stalled right under the 50-week average, in the 90.4 area, which turned the price back again this week. Zoom stock is carving 3 lower highs on the daily chart between Sep 4 and Sep 23, and in the last session almost all trading went to the sell side. On our technical analysis the sell signal is still 6.1% in profit, in a decline that has lost its fresh push: opening a short here remains high-risk among US tech stocks.
This week's summary
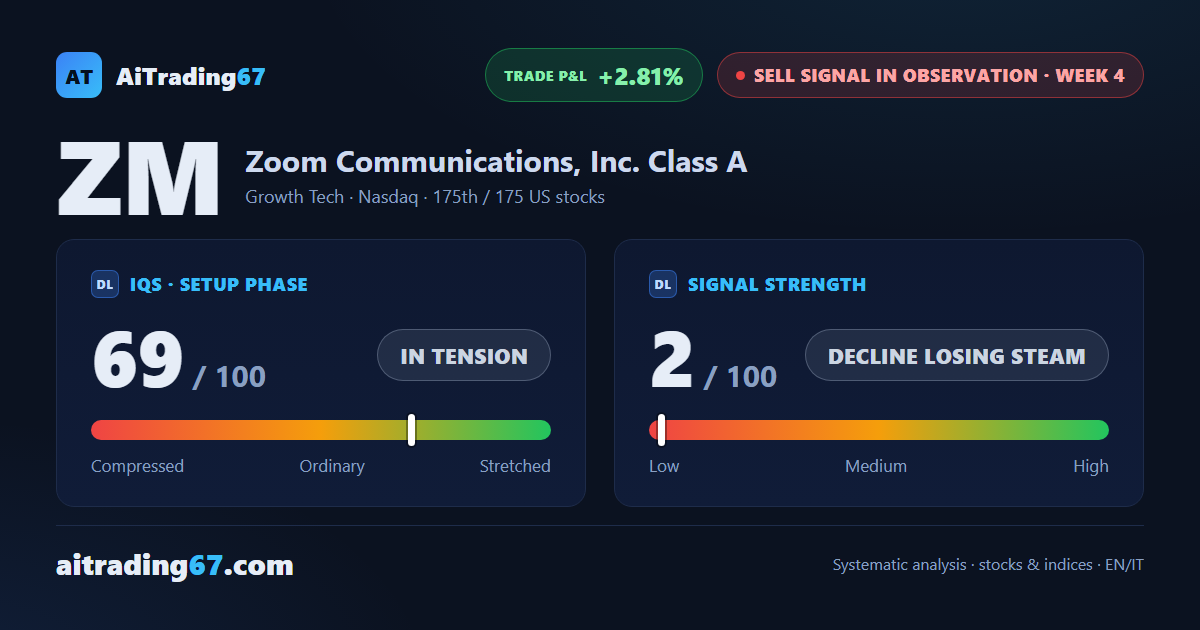
Zoom gains 3.5% and reclaims its 50-week average, the level that turned the price back a week ago. The bounce then stalled at the 20-week average, in the 94.5 area. On our technical analysis Zoom stock remains in a Sell signal whose strength has dropped to 2 out of 100, a decline with no fresh push: the short's gain shrinks from 6.1% to 2.8%, and among US tech stocks opening a new one here remains high-risk.
IQS Phase
69
in tension
Signal Strength
2
decline losing steam
Sizing
MINIMUM
Ranking
#175 / 175
US stocks sell signals
Trade P&L %
+2.81%
from signal to date, no stop loss
Zoom Communications (ZM) weekly chart — EMA50 · MACD · VWAP
Weekly chart · EMA50 · MACD · VWAP · Source: TradingView
Rank position
ranks 175th among the 175 sell signals for US stocks in our ranking, with a signal strength of 2 out of 100.
Sector context
SectorGrowth Tech
Benchmark ETFXLK
Sector regimein strong phase
Performanceweekly +1.80% · monthly +8.83%
ZM belongs to the growth tech sector (reference ETF XLK). The sector is classified in strong phase according to our weekly reading.
restricted Platinum content