
Sell signal, week 4 · US stocks
Abbott drops 3.7% after a rejection at its averages as money flow turns negative
Our view last week
After last week's 0.6% gain, Abbott stock gave back 1.3% and sellers moved back ahead in the weekly bar. The price action stays bearish: a band of moving averages between the 103 and 104.5 areas turned back the rebound, and price is now squeezed between the daily Kumo floor, in the 101.4 area, and the daily Inversion Point average, in the 101.1 area. The sell signal is in week 3, with the confirmation week still open.
This week's summary
The rebound stalled against the band of averages between the 102 and 103.5 areas and the week closed down 3.7%, with a fresh 30-day low in the 95 area. A week ago Abbott stock was squeezed into a corridor above the 101 area: that floor has given way. The technical analysis also records a turn in money flow, back in negative territory after 11 weeks. The Sell signal is picking up pace, yet from a swing trading standpoint opening a short at these lows is still high-risk.
Sell signal in observation
·4th week from start
·US stocks
·T2
·📅 Earnings · Oct 21
★ See Gold version →
IQS Phase
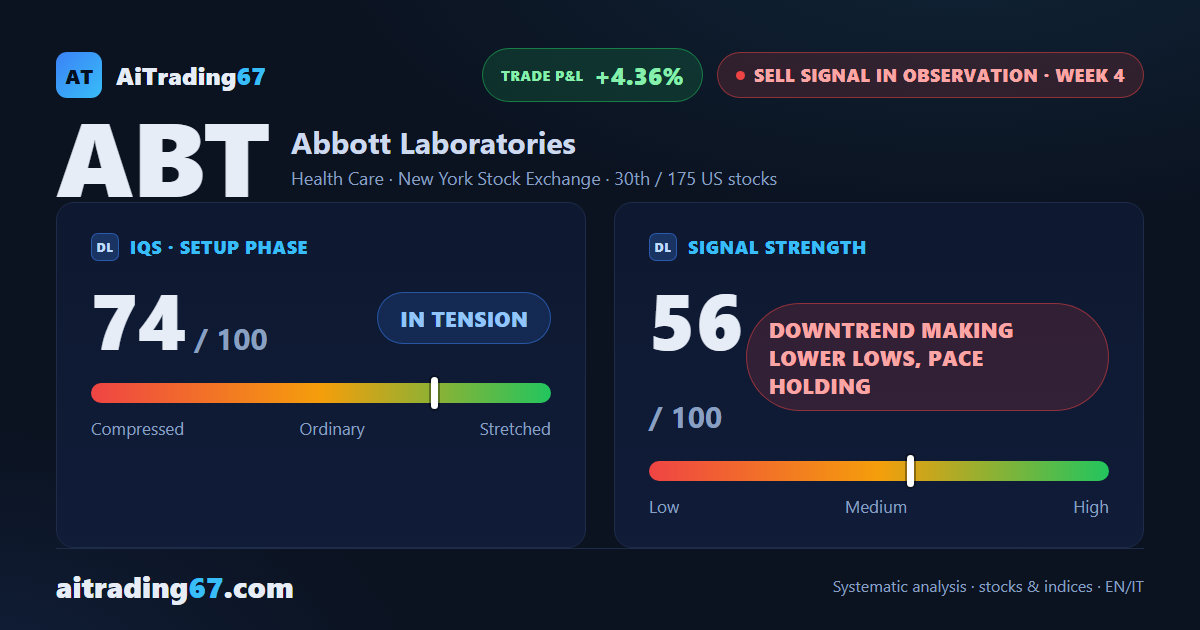
74
in tension
Signal Strength
56
downtrend making lower lows, pace holding
Sizing
STANDARD
Ranking
#30 / 175
US stocks sell signals
Trade P&L %
+4.36%
from signal to date, no stop loss
Abbott Laboratories (ABT) weekly chart — EMA50 · MACD · VWAP
Weekly chart · EMA50 · MACD · VWAP · Source: TradingView
Rank position
ranks 30th among the 175 sell signals for US stocks in our ranking, with a signal strength of 56 out of 100.
Sector context
SectorHealth Care
Benchmark ETFXLV
Sector regimein positive regime
Performanceweekly -2.65% · monthly -3.91%
ABT belongs to the health care sector (reference ETF XLV). The sector is classified in positive regime according to our weekly reading.
restricted Platinum content