
Sell signal · week 3 · US stocks
Baker Hughes drops 3.2% and slips back below the 50-week average it had just held
Our view last week
After 2 weeks of selling, Baker Hughes closes with a 1% gain and holds its 50-week average, where it came to rest last week. Money flow turns positive and nearly 94% of volume in the last session was on the buy side. For Baker Hughes stock the Sell signal remains a decline losing steam, with the weekly MACD histogram below zero: the price action is worth following, and among US stocks the quality band flags trading as not recommended.
This week's summary
The 50-week average, which held a week ago, gave way this time: Baker Hughes lost 3.2% and closed below it, after printing a new 30-day low during the week without confirming it on the close. For Baker Hughes stock the Sell signal is gathering pace, with the weekly MACD histogram falling for 4 weeks and money flow back in negative territory. Among US stocks the quality band still flags trading as not recommended, and earnings on October 27 are approaching.
Sell signal in observation
·3rd week from start
·US stocks
·T2
·📅 Earnings · Oct 27
★ See Gold version →
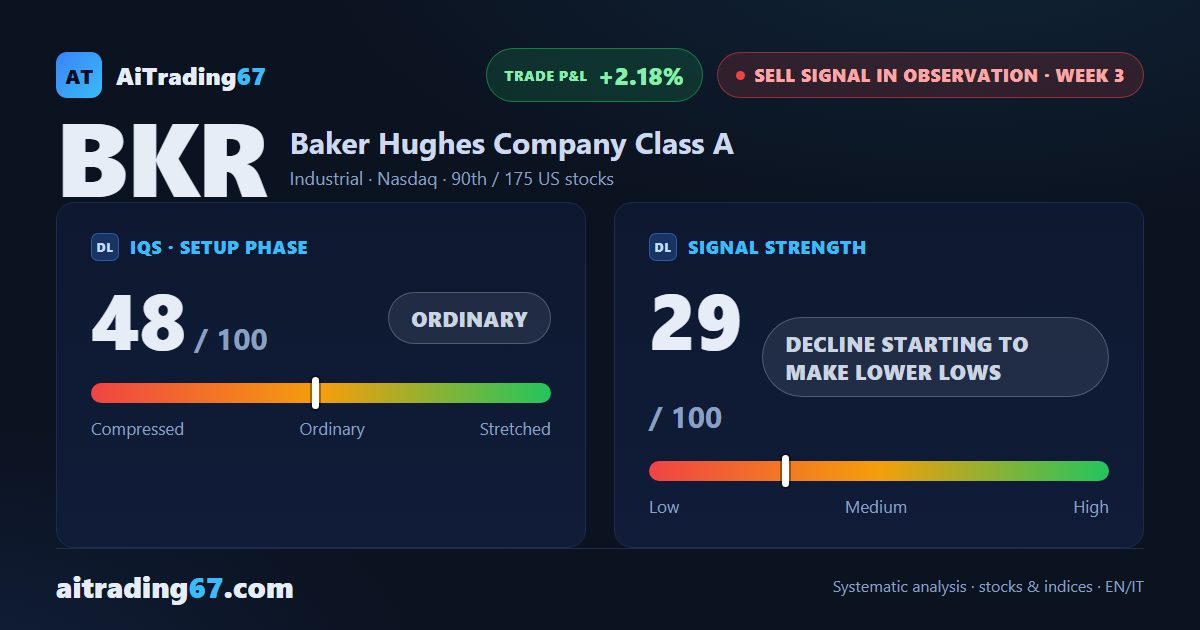
IQS Phase
48
ordinary
Signal Strength
29
decline starting to make lower lows
Sizing
MINIMUM
Ranking
#90 / 175
US stocks sell signals
Trade P&L %
+2.18%
from signal to date, no stop loss
Baker Hughes (BKR) weekly chart — EMA50 · MACD · VWAP
Weekly chart · EMA50 · MACD · VWAP · Source: TradingView
Rank position
ranks 90th among the 175 sell signals for US stocks in our ranking, with a signal strength of 29 out of 100.
Sector context
SectorIndustrial
Benchmark ETFXLI
Sector regimeweak phase
Performanceweekly -0.28% · monthly -1.64%
BKR belongs to the industrial sector (reference ETF XLI). The sector is classified weak phase according to our weekly reading.
restricted Platinum content